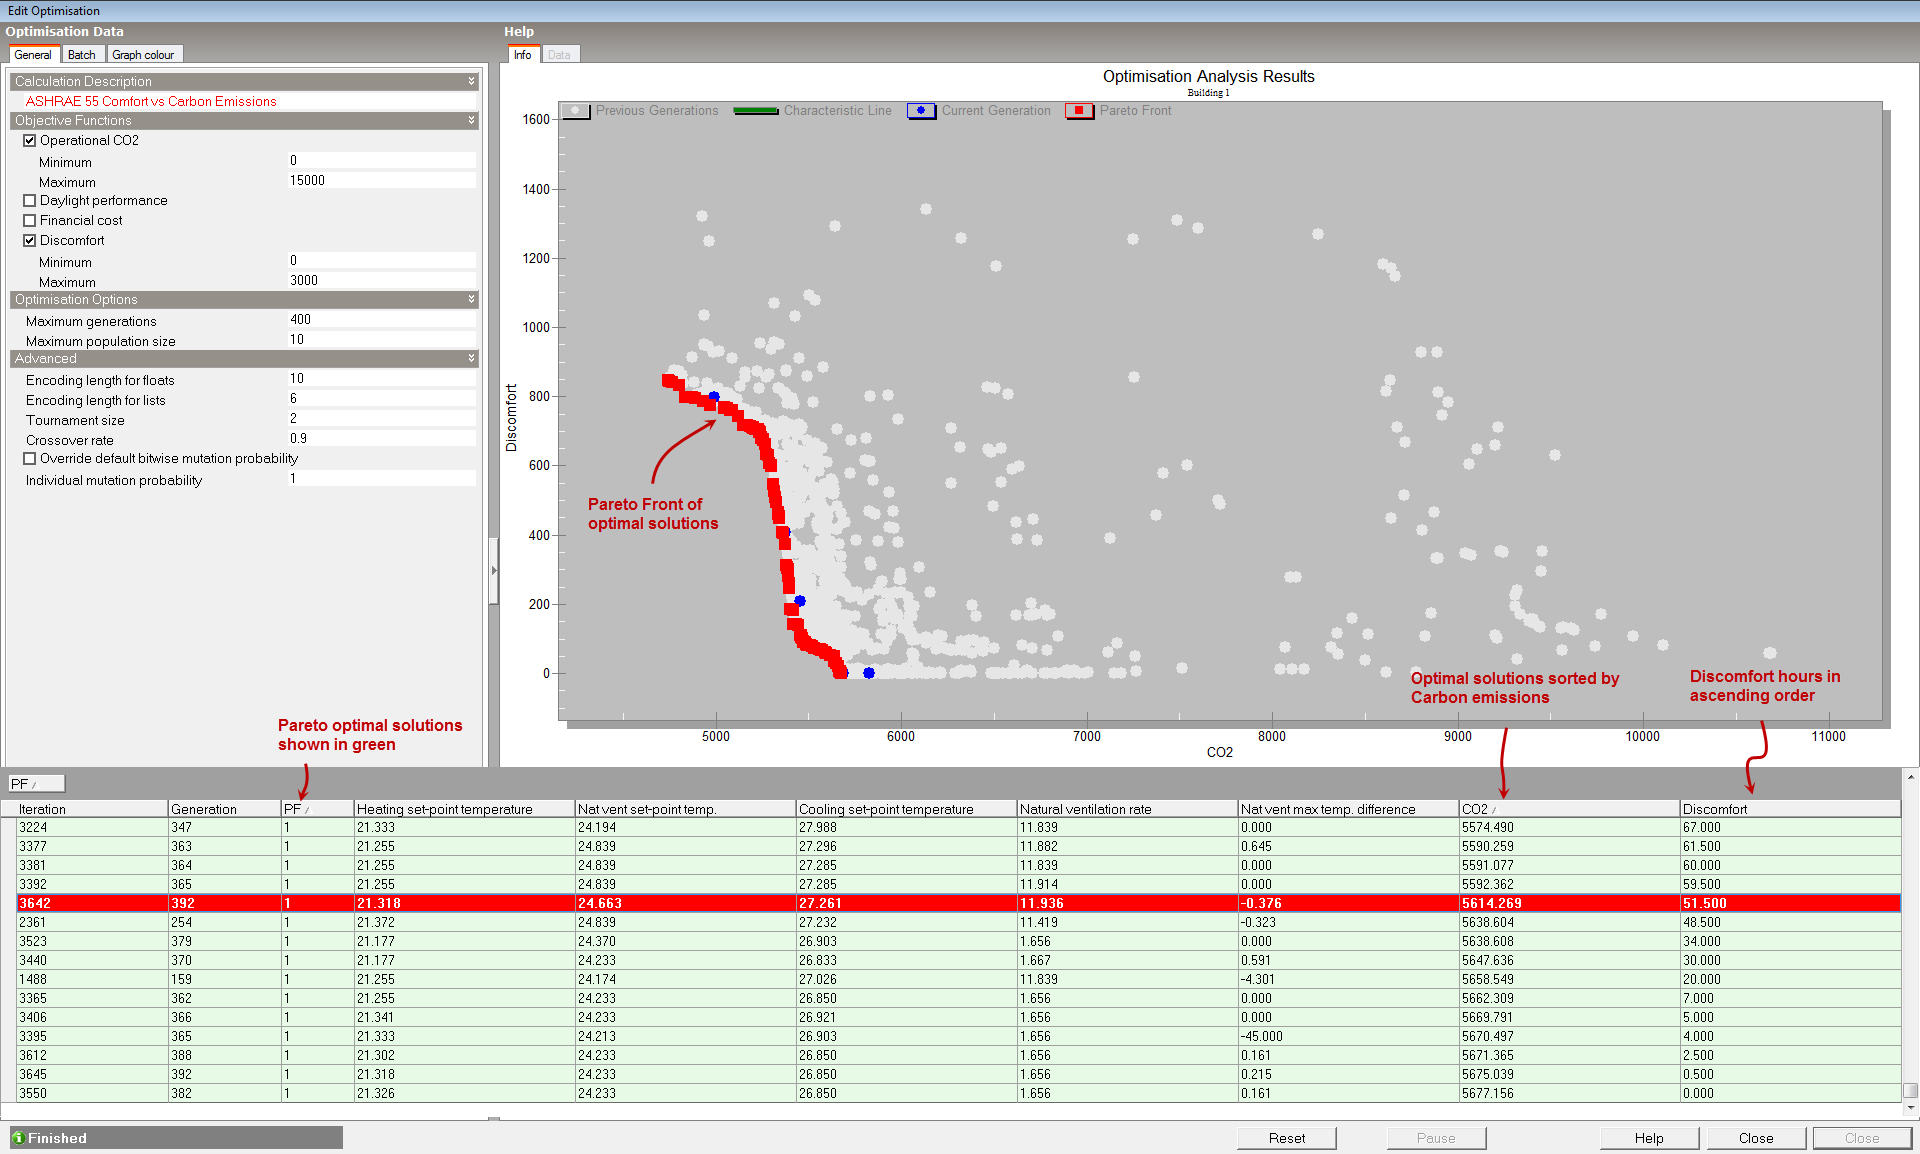
In beta test versions the best way to view optimisation results is in the Optimisation Calculation Options dialog as this also displays the grid of results including variable values. The same scatter graph can be seen on the Optimisation tab of the Simulation screen but it does not allow the grid to be viewed at the same time.
The screenshot below illustrates some of the main outputs of the Optimisation analysis.