Optimisation is a technique for efficient searching for and identifying design options that best meet key design performance objectives. it is similar in many ways to Parametric analysis, a more well-known technique for analysing how design performance varies with changes in the building configuration through use of design curves. A parametric analysis would usually consist of 1, 2 or 3 design variables being adjusted in a systematic way to illustrate trends and find designs with the most favourable characteristics (e.g. low energy consumption, best comfort etc). With parametric analysis, a maximum of 3 variables is normally used because a) the results of more than 3 dimensions to a design problem are difficult to visualize and b) the large number of simulations required with 4 or more design variables would take too long to complete. For example a designer might want to investigate the impact on carbon emissions of variable levels and types of glazing. The results would be displayed as a series of parametric design curves. This can be a very useful way to visualise simple comparisons over a limited range of design options, but is of less use for wider studies and for optimisation as only a few variables and one key performance indicator can practically be included per analysis.
In DesignBuilder Optimisation, Genetic Algorithms (GA) (aka Evolutionary Algorithms or EA) are used to search for optimal design solutions, much more efficiently than is possible with parametric analysis when more variables are involved. In DesignBuilder, up to 10 design variables can be included in the analysis in combination with up to 2 objectives, such as "minimise carbon emissions" and "minimising construction costs". Cost and carbon are a frequently used pair of objectives in building design optimisation analyses because they allow a study of the trade off between cost and carbon impacts for a large range of designs. For example, an optimisation study might involve a base design which is to be optimised for cost and carbon emissions with building orientation, wall and roof construction, glazing amount and type, degrees of shading and HVAC system type being allowed to vary. The results might be displayed graphically with operational carbon emissions on one axis and investment cost on the other and the performance of each design option that is tested as part of the procedure plotted on the graph. The designs with lowest combinations of cost and carbon form a "Pareto front" of optimal designs along the bottom-left edge of the data point "cloud".
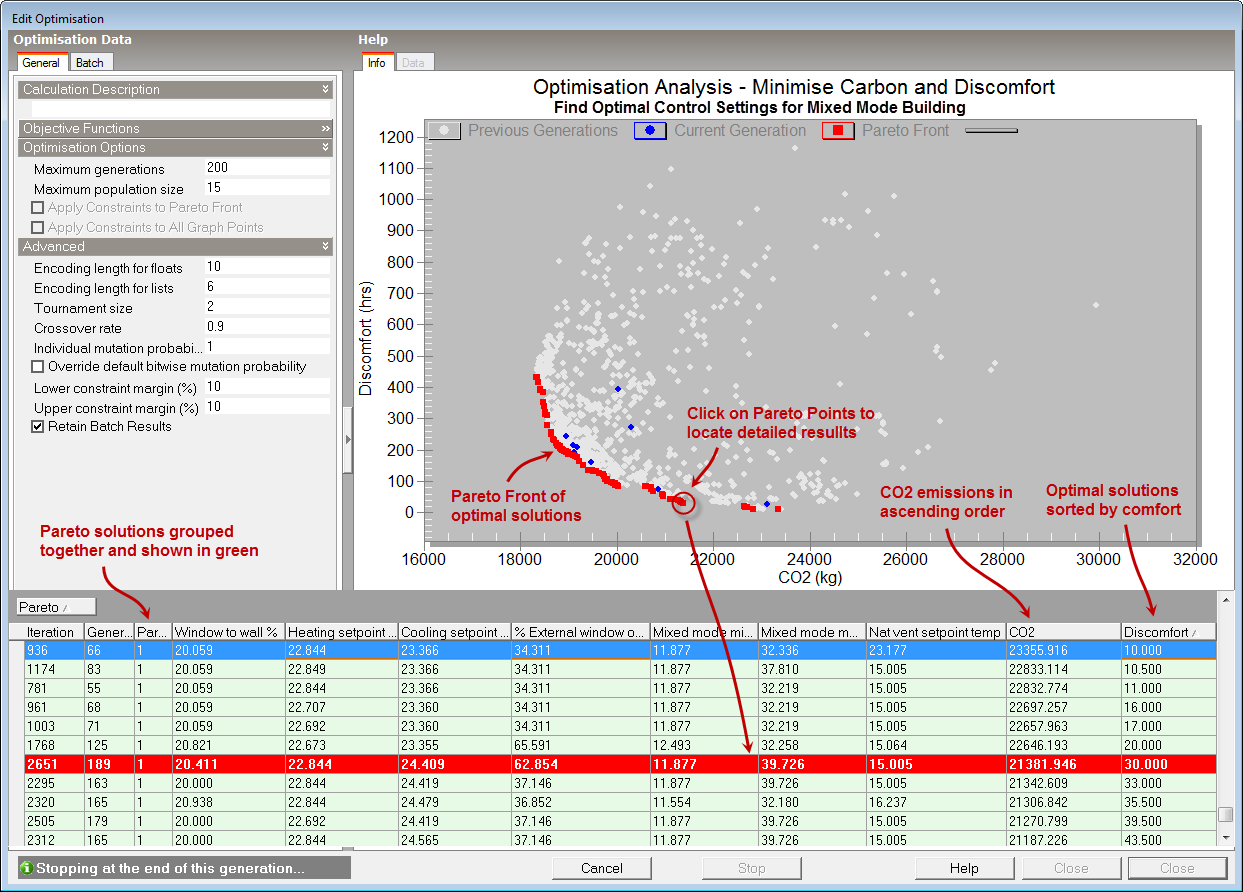
Likewise "minimise carbon emissions" and "minimise discomfort" are often used to analyse the trade off between carbon emissions and the degree of comfort provided by the design. In the example output below the control parameters of a changeover mixed mode natural ventilation model is being optimised based on carbon emissions and discomfort. The outputs indicate the control options resulting in minimal discomfort hours while at the same having the lowest environmental impact.
Tip: A good starting point to learn more about design optimisation is follow through the Optimisation Basic Tutorial.
To get started with an optimisation analysis go to the Simulation screen and click on the Optimisation tab. From the Simulation Optimisation screen you can: