Urban Heat Island (UHI) tab
Urban areas are usually warmer than the surrounding rural areas. You can account for these effects in Climate Analytics by adding or subtracting recorded day and night-time offsets to the hourly temperature values in the hourly weather data you download.
These temperature offsets are defined on the "Urban Heat Island" tab of the Station dialog. The process is as follows:
1. From the Station dialog, go to the "Urban Heat Island" tab.
2. Check the “Use Urban Heat Island Offset” check box.

3. Start the process of selecting UHI data by clicking on the “Select a UHI” button.
4. After clicking on the “Select a UHI” button, the Station dialog is temporarily closed allowing you to review and select the UHI whose temperature offsets you wish to apply.
5. To review the local UHI data move the mouse over a red or yellow circular coloured icon. As the mouse hovers over an icon, the extent of the UHI region is displayed in dark red (see illustration below where the Oxford UHI region is displayed) along with a summary panel with the key data for the UHI.
To select the UHI region click on the corresponding red or yellow circular icon or on the dark red UHI region itself.
To return to the Station dialog without selecting a UHI icon press the <Esc> button.
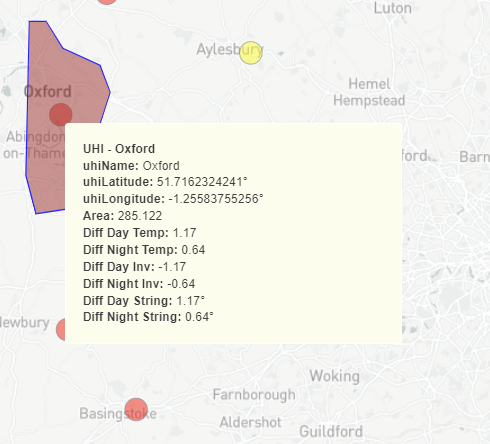
Note: Red icons indicate UHI regions where the temperature is higher during both the day and the night. The yellow icons indicate regions where the offset is negative for day and/or nightime, i.e. the urban region is typically cooler than the neighbouring rural areas at some point during the day.
6. After clicking on the UHI region, the Station dialog is re-opened and the day and night-time offset text boxes are populated with data from UHI database.
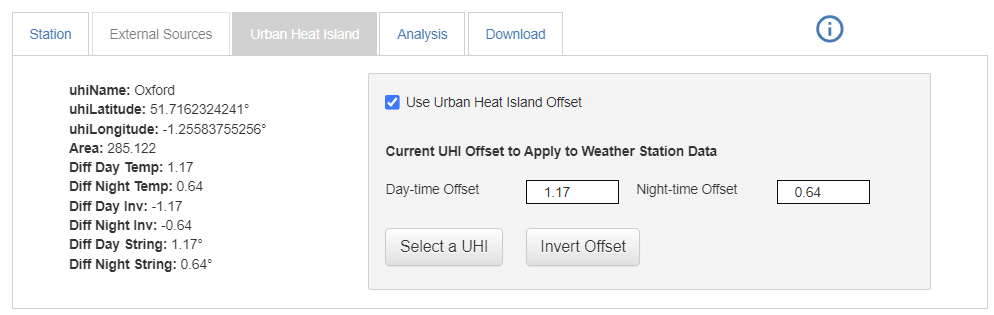
Alternatively if you have specific data you wish to use, you can manually enter known offsets in the Day-time Offset and Night-time Offset text boxes.
Day-time and night-time offsets represent the maximum and minimum temperature differences between the surrounding rural and the urban locations. The rest of the hours are interpolated using these values and an algorithm to generate the UHI curve.
By default, it is assumed that temperature data is recorded in the rural area and the building is located in the urban area. However, in the reverse situation, you can invert the UHI values using the “Invert Offset” button.
Note: UHI offsets can only be applied to Design Year data. Actual Year downloads are unaffected by these settings.
UHI Data Sources
The Urban heat island data used in Climate Analytics is published by NASA and comes from the Center for International Earth Science Information Network (CIESIN), Columbia University. Global Urban Heat Island (UHI) Data Set, 2013. Palisades, NY: NASA Socioeconomic Data and Applications Center (SEDAC).