Viewing and Editing EPW Files
The EPW weather files downloaded from Climate Analytics can be edited and viewed through a variety of tools and techniques, the most important of which are summarised below.
Editing EPW files
EPW files are text files and can be edited in any text editor. However it is usually much more convenient to edit EPW files in some form of spreadsheet or grid tool. Some examples of tools that can be used for editing EPW files are:
Elements
Developed by Big Ladder Software, Elements is a free, open-source, cross-platform software tool for creating and editing custom weather files. It provides a spreadsheet environment and allows individual values to be edited or ranges of data can be pasted in from an external spreadsheet program.
Features include:
-
Read/write common weather file formats
-
DOE-2 (.BIN, .FMT)
-
EnergyPlus (.EPW)
-
-
Browse/edit weather data
-
Smart spreadsheet editor
-
Automatic preservation of psychrometric and solar relationships
-
Tools for bulk data transformation: offset, scale, normalise
-
Copy and paste to/from Excel
-
File header editor
-
IP or SI units
-
-
Visualize weather data
-
Dynamic, multi-variable line chart (experimental)
Source code and issue tracker are hosted on the Big Ladder repository.
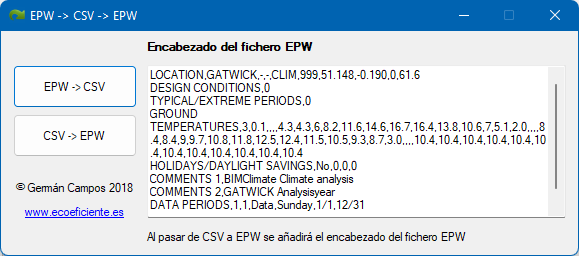
Ecoeficiente Conversor
Another utility that simplifies the process of editing EPW files is provided by Ecoeficiente. It converts EPW files to the CSV format which can be edited in Excel and then the edited CSV file can be converted back to EPW format for use in simulations. You can download this utility from: ecoeficiente.es/conversor-epw-a-csv
Excel
A quick alternative way to edit an EPW file is by reading it directly into Excel, making the edits and writing the file back out using the Excel TXT format with tabs as delimiters. Then in a text editor search and replace tab characters for comma and save with an EPW extension. The process of reading EPW files into Excel is described in more detail below.
Note: Whenever editing EPW weather data in a text editor you should make sure to use Windows line endings when saving rather than the Unix ones. This will normally be the default if you are working on a Windows machine.
Viewing EPW File Data
There are a number of ways to view the hourly data in EPW files. The list below gives the methods that have been tried and tested by the technical team at DesignBuilder.
DesignBuilder Results Viewer
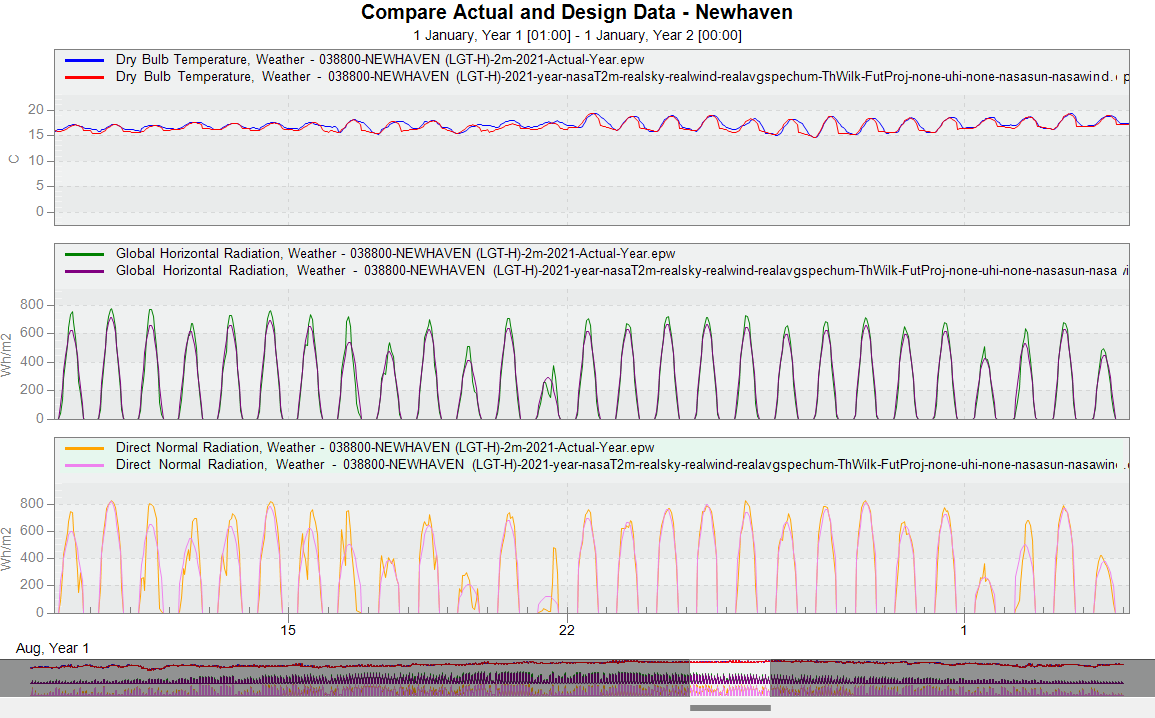
DesignBuilder Results Viewer is available as a free standalone desktop application and in v4 and later you can load one or more EPW files to view and/or compare data.
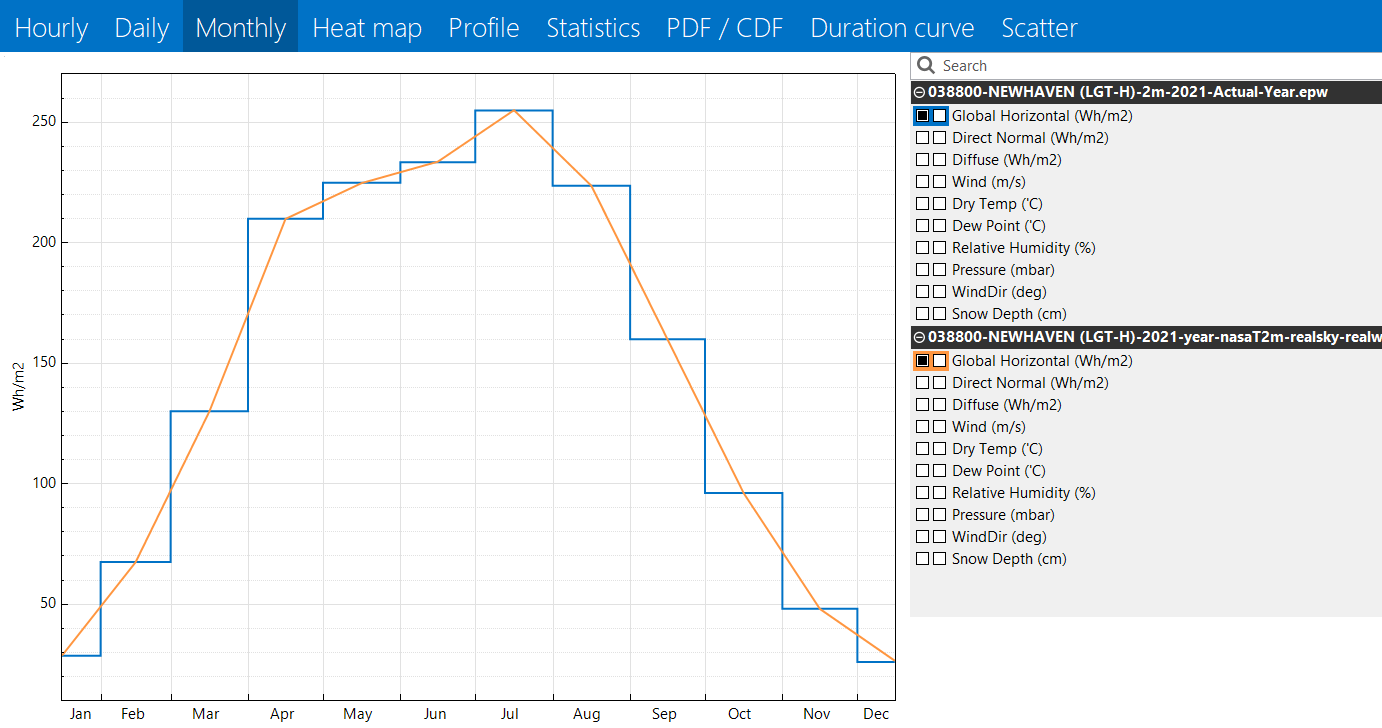
Time series hourly data is viewed with time on the X-axis by default. The example screenshot below shows the data in 2 EPW files for the same location being compared on an hourly basis:
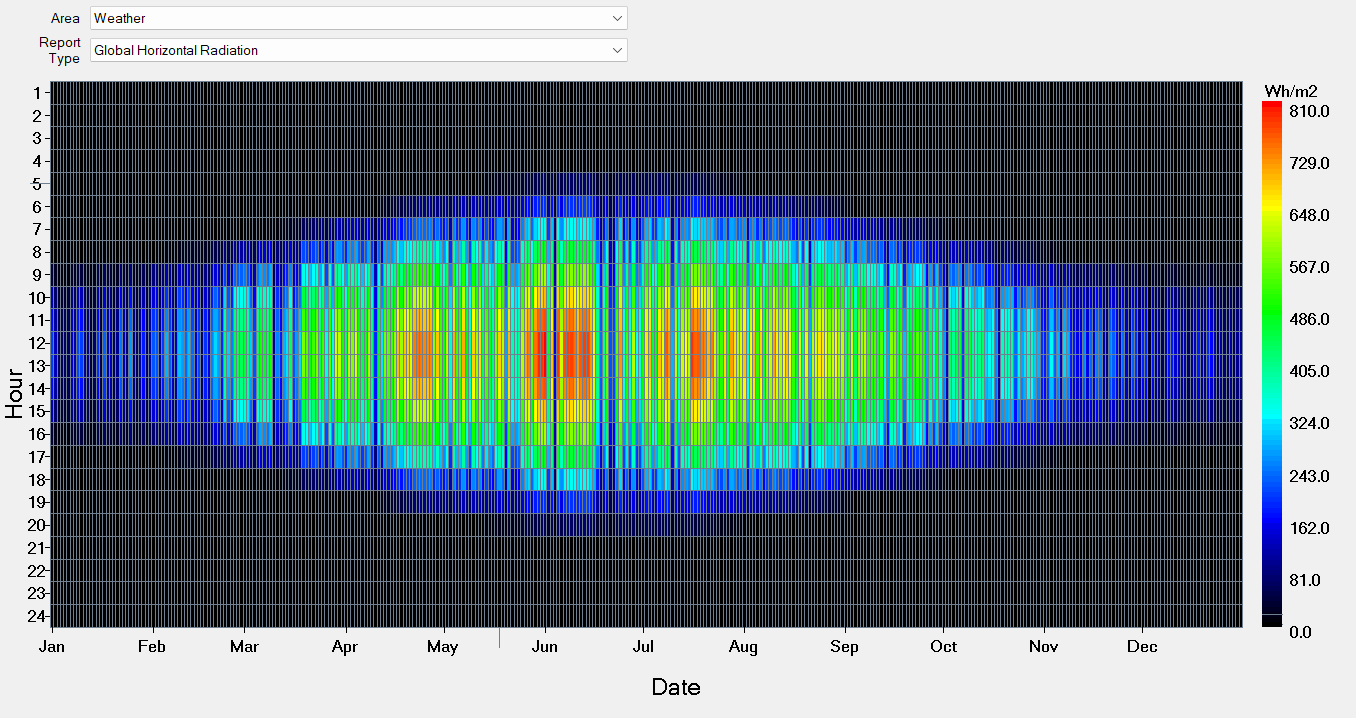
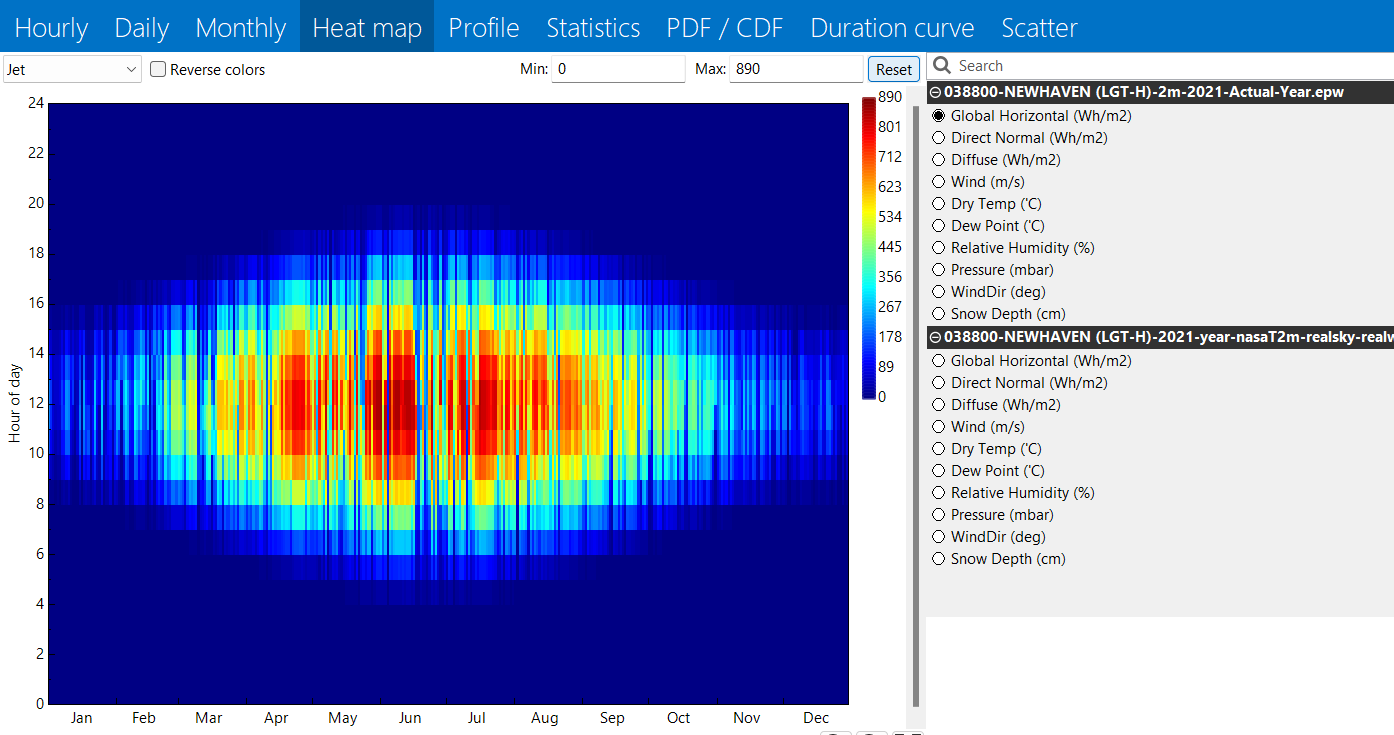
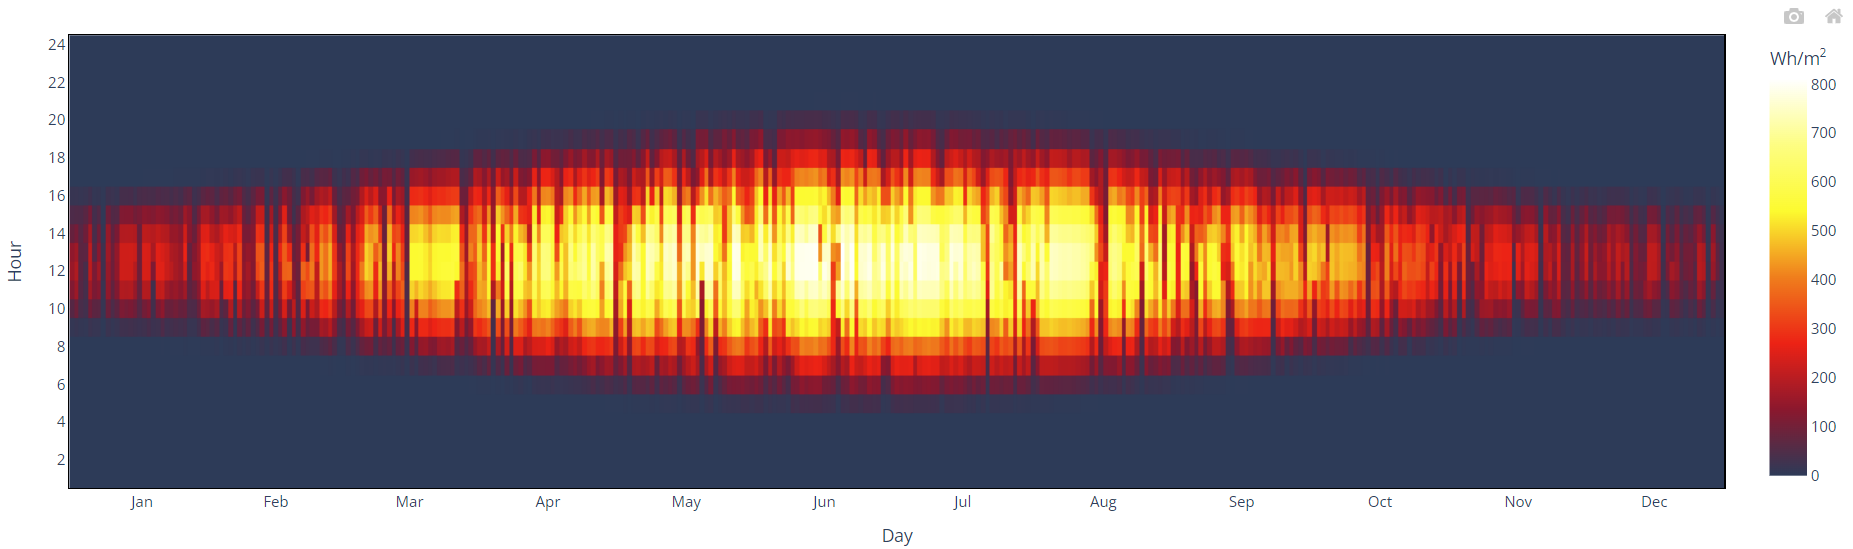
Alternatively, the Heat Map graph displays a whole year of data at once, with the day of the year on the x-axis and time of day on the y-axis with each hour corresponding to a small rectangle. That rectangle is assigned a colour based on the value for that hour. This format allows for easy identification of both diurnal and seasonal patterns. The example below shows the Global Horizontal Solar Radiation. The image shows that the days are longer in the summer than in the winter, with the most intense radiation occurring in April, June and late July:
DView
DView is available as a free standalone desktop application for visual analysis of time-series data at any timestep (e.g., hourly or sub-hourly). DView opens EPW files.
Monthly and Daily average and total data can be automatically generated from hourly weather data by summing and averaging:
As for ResultsViewer, the Heat Map graph displays a whole year of data at once, with the day of the year on the x-axis and time of day on the y-axis, with each hour corresponding to a small rectangle:
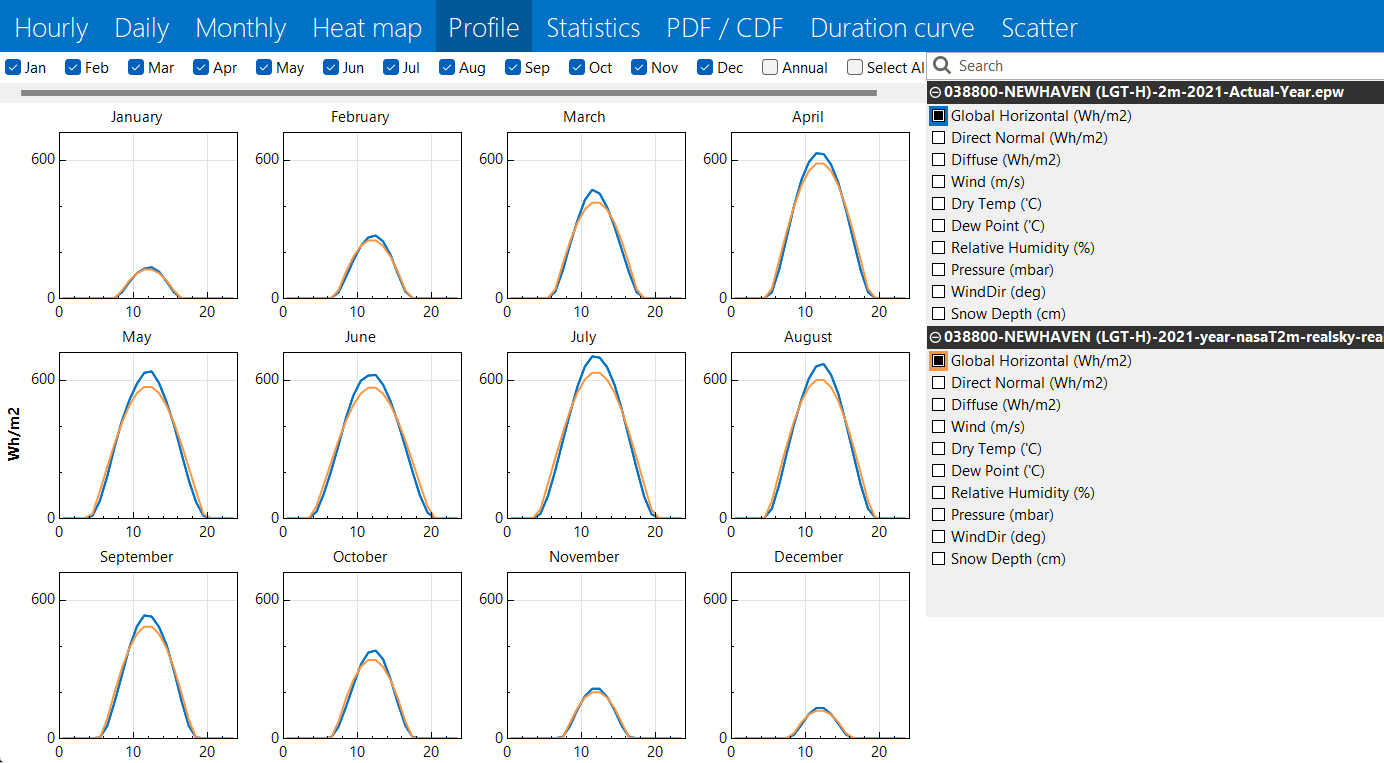
The Profile graph illustrates average daily profiles for each month of the year and an annual average daily profile. The graph below demonstrates daily profiles for Global Horizontal Solar for an example location:
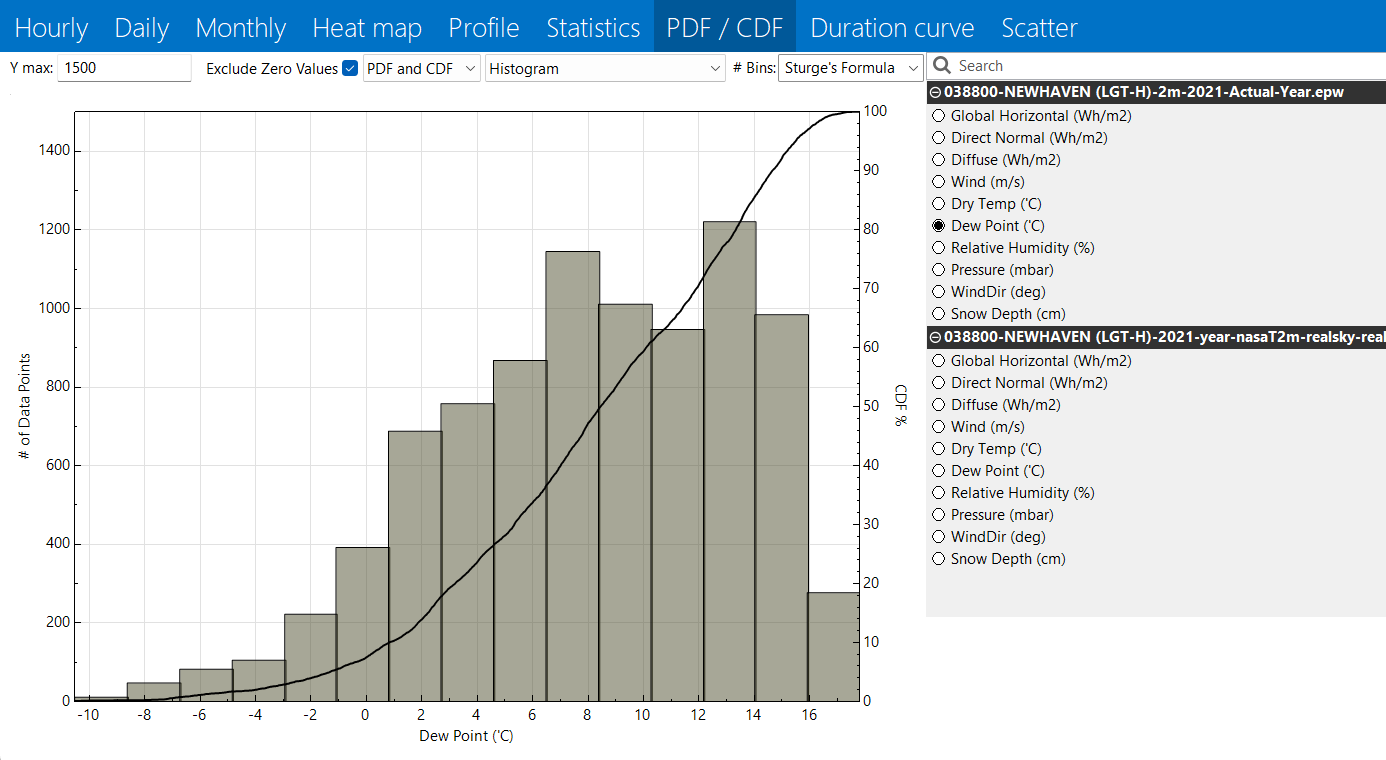
The PDF/CDF graph shows the Probability Distribution Function (PDF) and Cumulative Distribution Function (CDF) for the dataset. These functions are useful to illustrate the distribution and spread of values for a given variable:
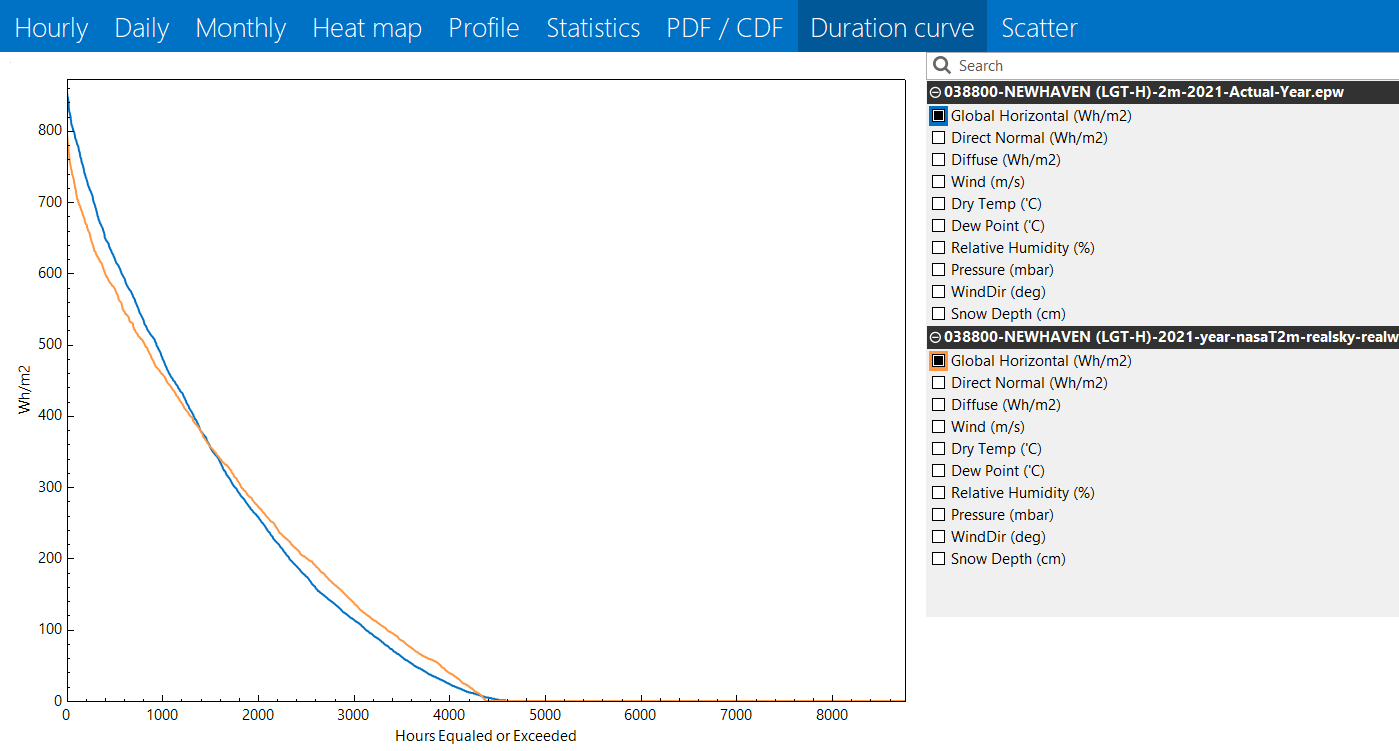
The Duration curve orders the data from highest value to lowest value. By doing so, one can quickly identify, for example, the number of hours for which the variable is above or below a certain threshold:
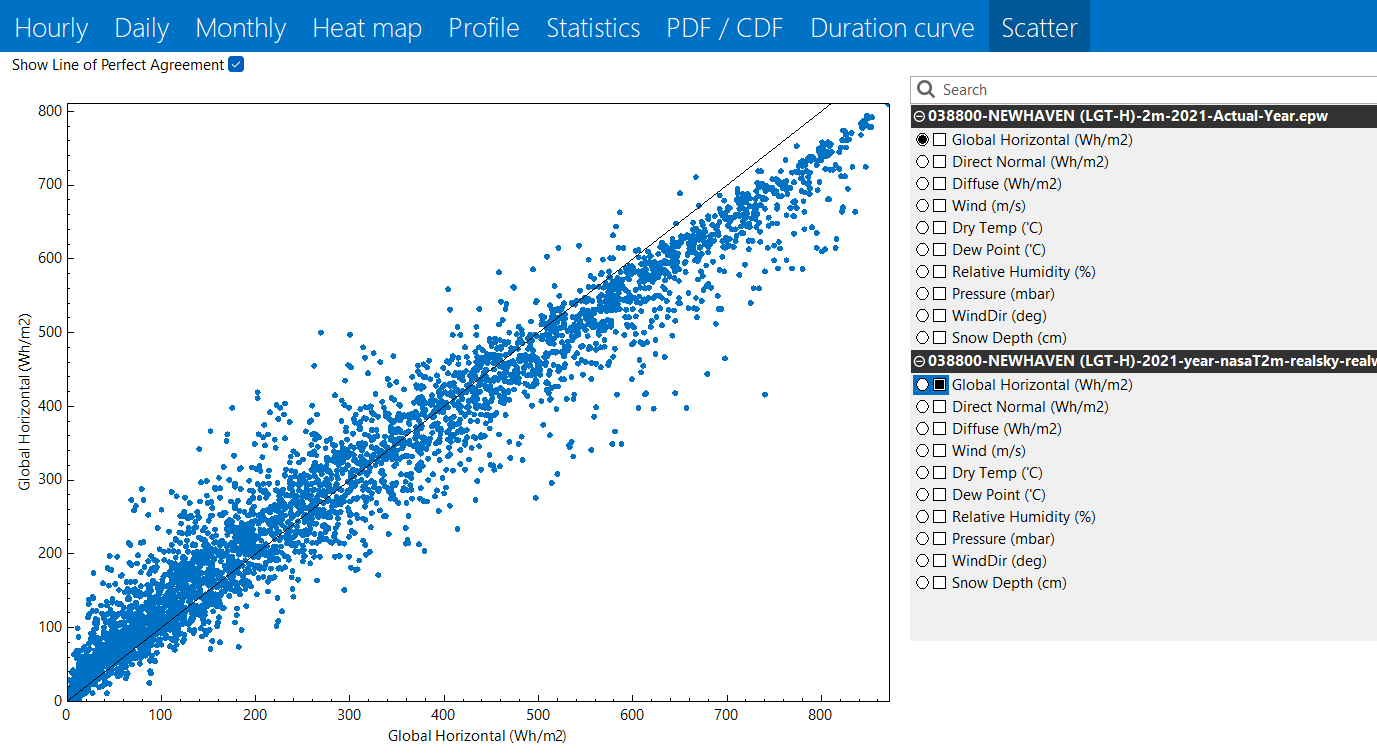
The Scatter plot allows graphing one or more y-axis variable against an x-axis variable. For example, the graph below shows a scatter plot for Global Horizontal Solar from Actual and Design sources for 2021. In this case it is being used to compare the Design against the reference Actual data. A "line of perfect agreement" can be displayed.
Excel
As mentioned above under the Edit section, Excel, or any other spreadsheet tool, can be used to display the data in an EPW file.
The process is as follows:
1. Open Excel and select the "File > Open > Browse" menu option.
2. Select your EPW file.
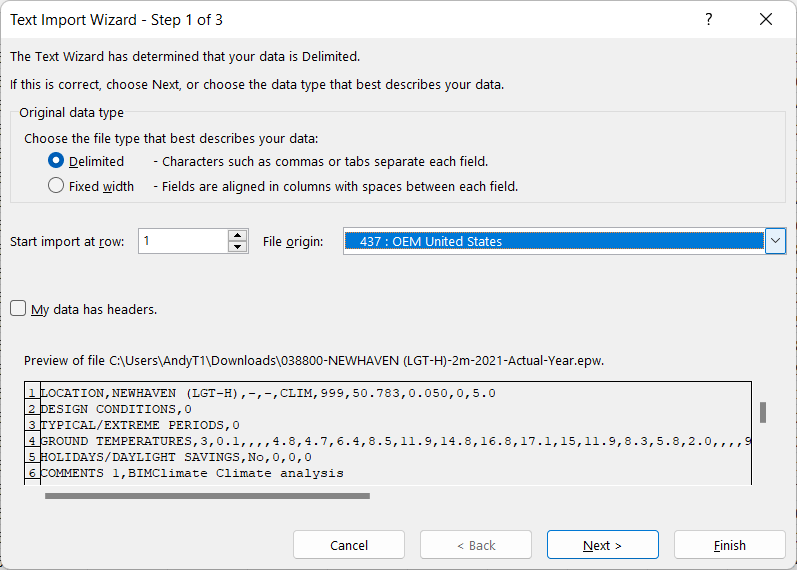
3. On the Import Wizard select the "Delimited" option as shown below and press Next.
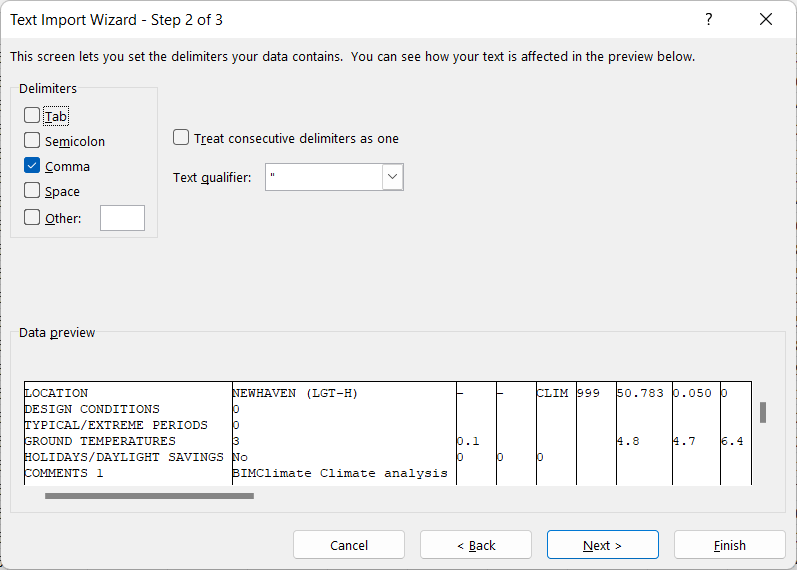
4. Select the Comma delimiter, as shown below and press "Finish".
5. The data should now be loaded into Excel:
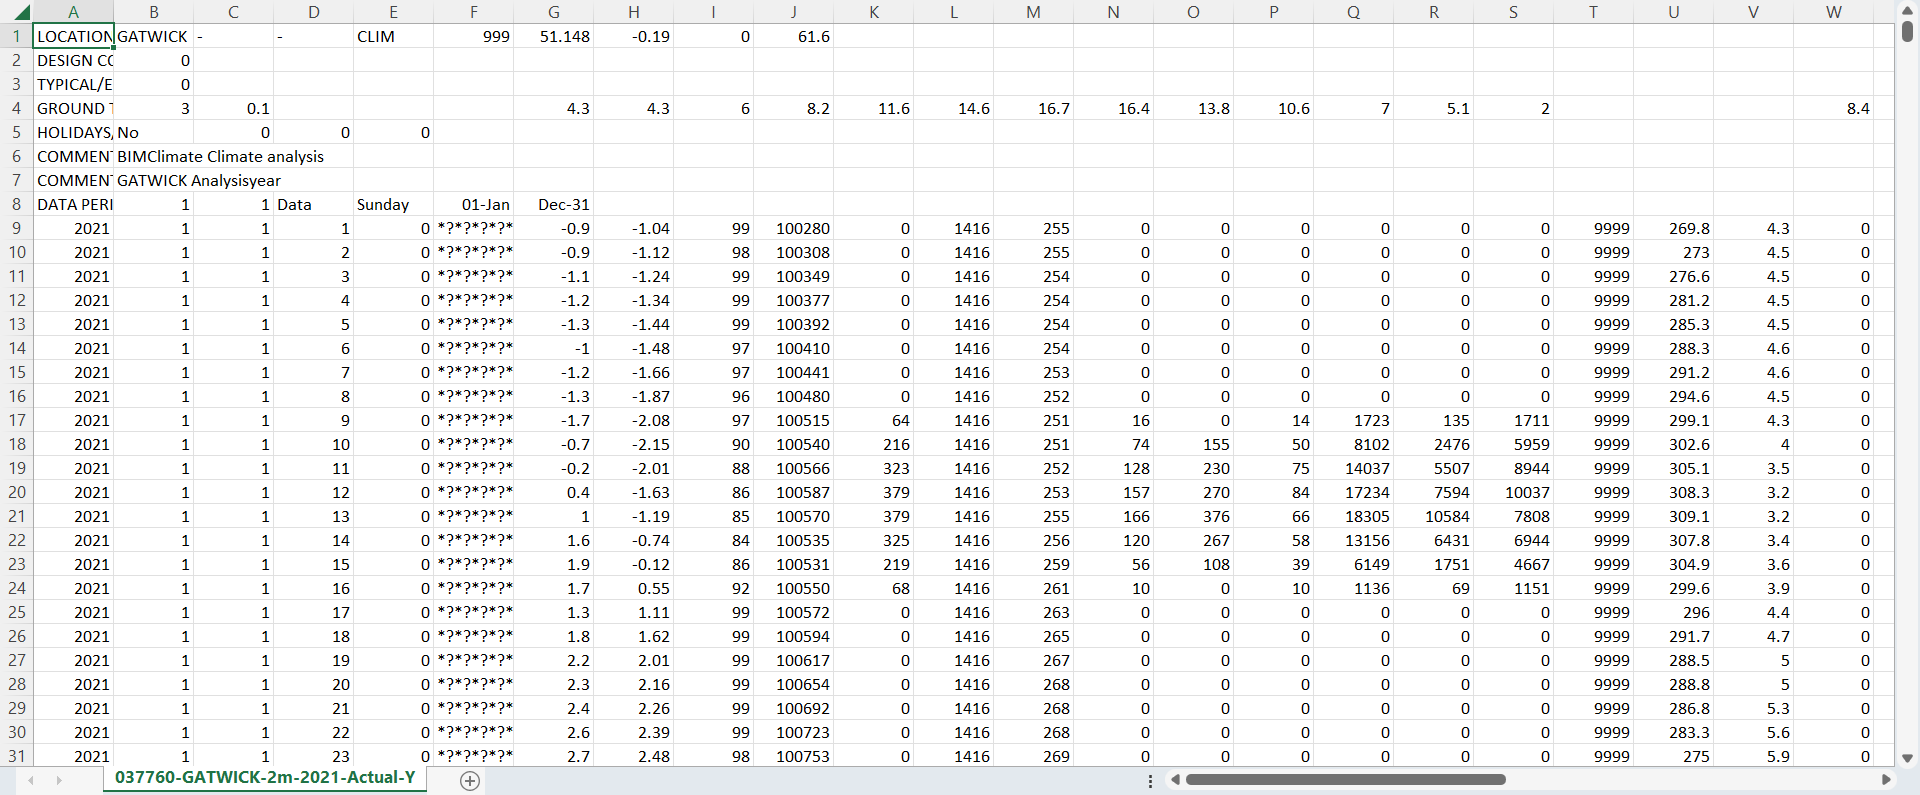
6. Then if a graphical representation is required use standard Excel tools to graph the data. For example, to display Global Horizontal Radiation, check theGlobal Horizontal Radiation help section to confirm that this data is in column N. Then mouse click on cell N9, press Shift-End-Down to select all of the data, click on the Insert menu and select one of the line graph options to create a graph:
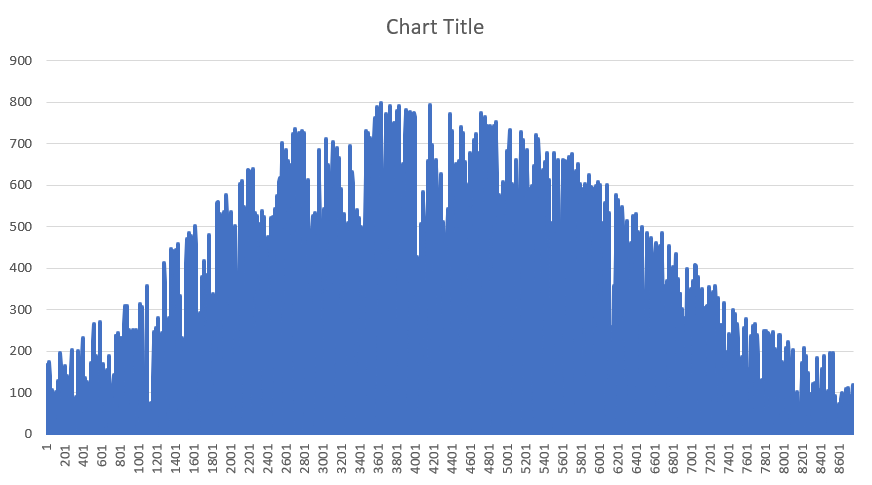
Excel graphing is less convenient than using ResultsViewer and DView as there is no easy way to zoom in. On the other hand, in Excel you get full access to all of the numeric data and Excel's statistical functions which can be helpful.
CBE Clima Tool
The CBE Clima Tool is a free and open-source web application built to support climate analysis. It provides climate data from EnergyPlus and Climate.One.Building.org databases but you can, also upload EPW weather files downloaded from Climate Analytics.
The tool calculates a number of derived climate-related values such as solar azimuth and altitude, Universal Thermal Climate Index (UTCI), comfort indices, etc.) that are not contained in the EPW file.
Data View 2-D Weather Data
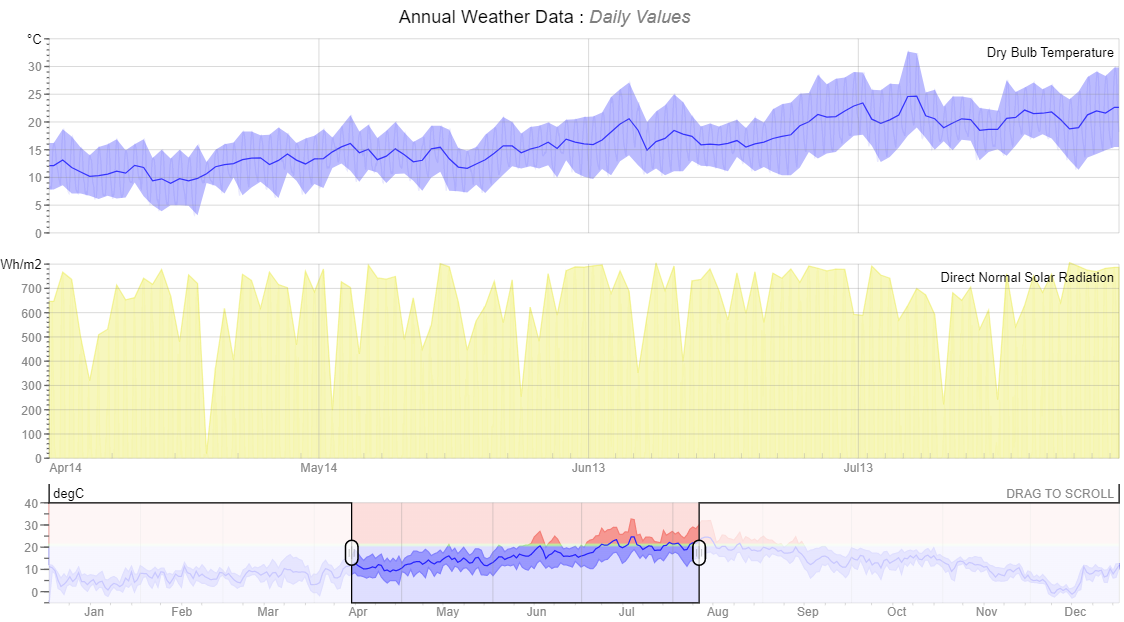
This web application displays annual hourly weather or analysis data in a series of synchronised charts. It can read EnergyPlus weather data (EPW) as well as EnergyPlus output data files (CSV). As both these formats contain large amounts of hourly data, it lets you select which metrics to view and compare as well as the date range over which to render them.
Note that this website does not provide a secure connection which may prevent it from being displayed directly within the help browser on your system.
Data View 2-D
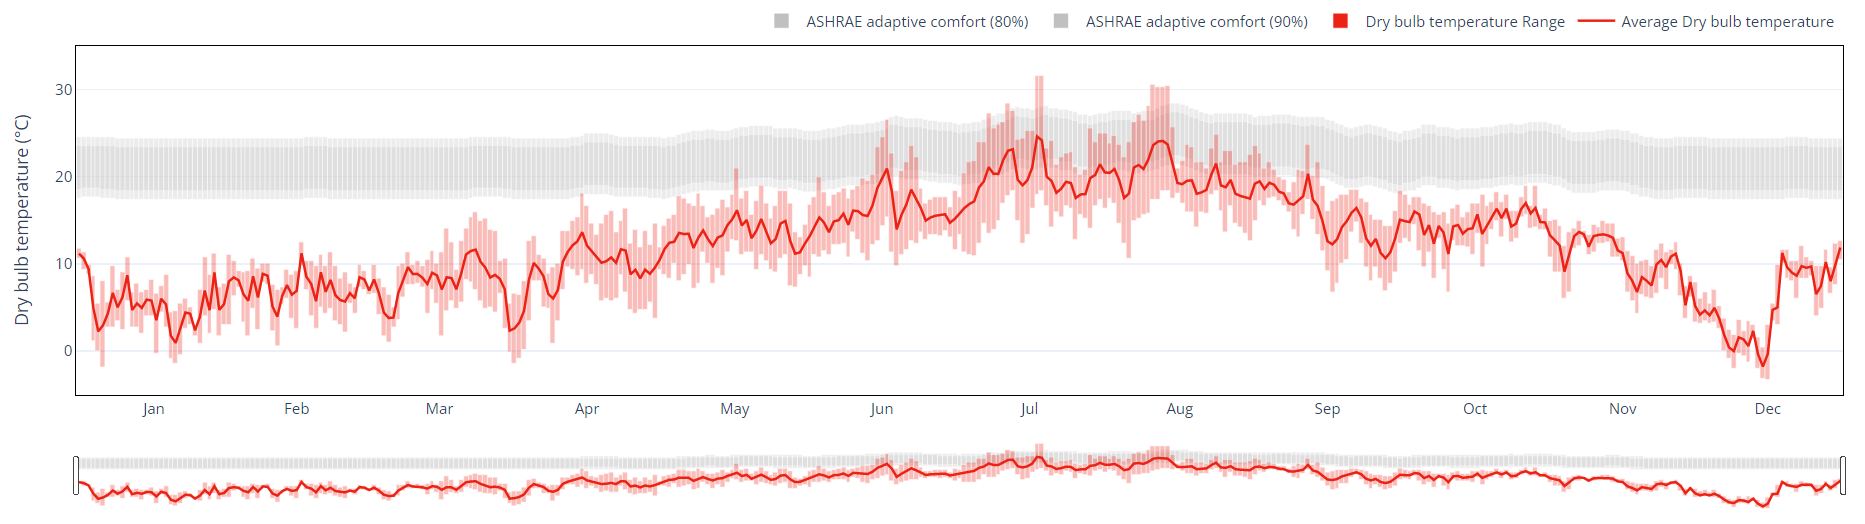
The main 2-D epw viewer web page allows you to plot any of the variables in the epw file in various ways in a nicely formatted view.
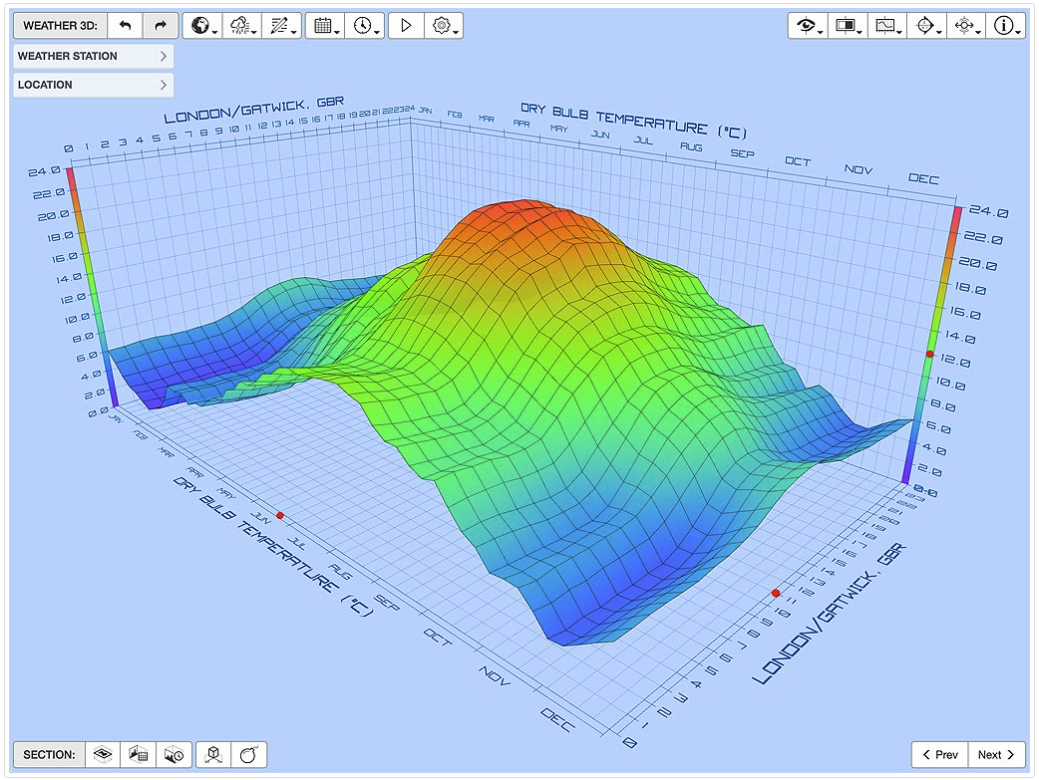
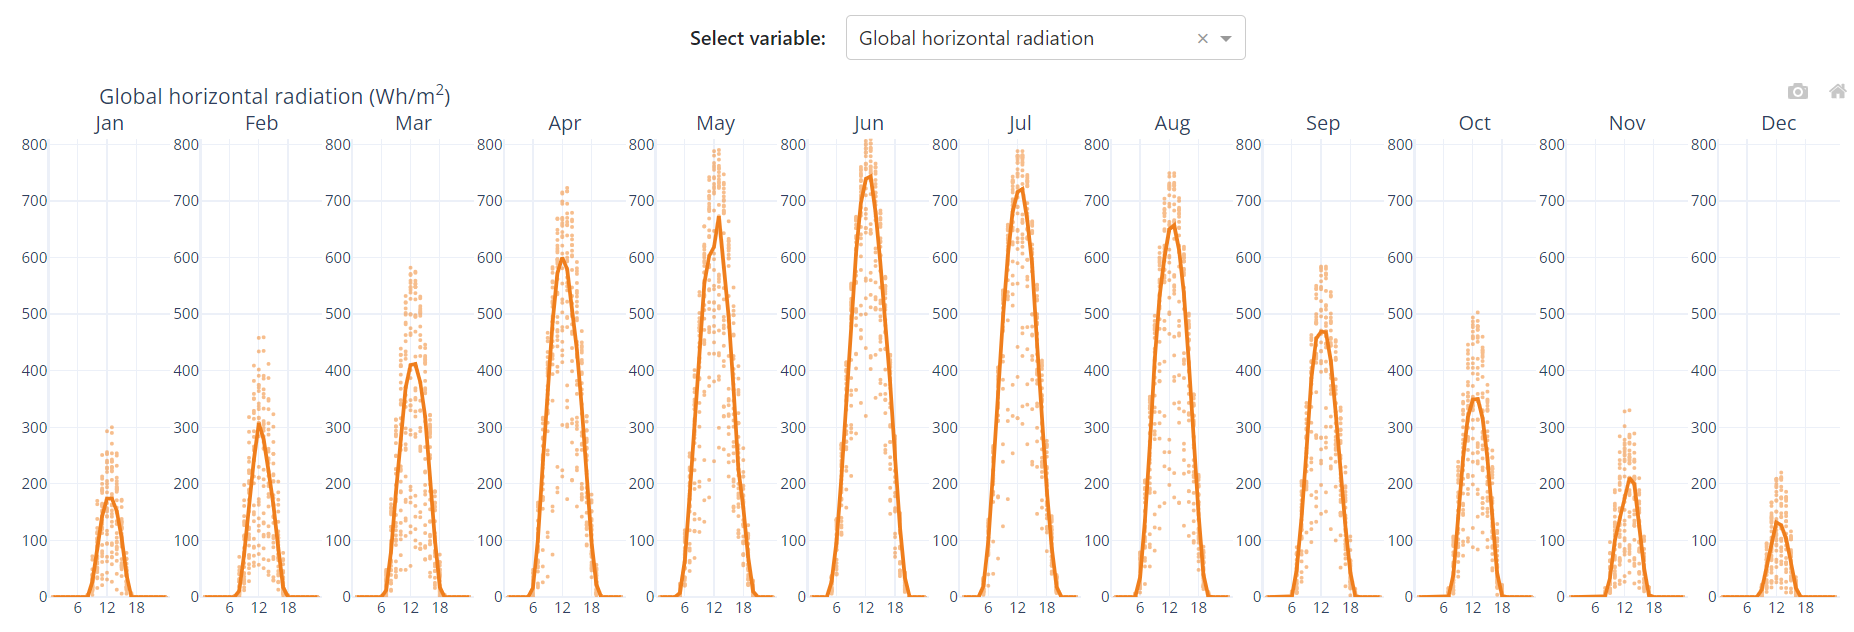
Data View 3-D
Alternatively, this web page provides 3-D graphical outputs for the main variables in the epw file that you upload. For example: