Comfort Analysis
DesignBuilder EnergyPlus simulations can generate extensive data on environmental conditions
within the building and resultant occupant comfort levels. The
following comfort-related output is available:
- Internal air temperature
- the calculated average temperature of the air.
- Internal radiant temperature
- the average
Mean Radiant Temperature (MRT) of the zone, calculated assuming that the
person is in the centre of the zone, with no weighting for any particular
surface.
- Internal operative temperature
- The mean of the internal air and radiant temperatures.
- Outside dry-bulb temperature
- site data.
- Relative Humidity
- the calculated average relative humidity of the air.
- Fanger PMV - Fanger Predicted Mean Vote calculated according to ISO 7730.
- Pierce PMV ET -
the Predicted Mean Vote (PMV) calculated using the effective temperature
and the Pierce two-node thermal comfort model.
- Pierce PMV SET -
the Predicted Mean Vote (PMV) calculated using the 'Standard' effective
temperature and the Pierce two-node thermal comfort model.
- Pierce Discomfort Index
(DISC) - the Discomfort index calculated using the Pierce two-node
thermal comfort model.
- Pierce Thermal Sens. Index
(TSENS) - the Thermal Sensation Index (PMV) calculated using the
Pierce two-node thermal comfort model.
- Kansas Uni TSV -
the Thermal Sensation Vote (TSV) calculated using the KSU two-node thermal
comfort model.
- Discomfort hrs (summer
clothing) - the time when the combination of zone humidity ratio
and operative temperature is not in the ASHRAE 55-2004 summer
clothes region.
- Discomfort hrs (winter
clothing) - the time when the combination of zone humidity ratio
and operative temperature is not in the ASHRAE 55-2004 winter
clothes region.
- Discomfort hrs (all clothing)
- the time
when the combination of zone humidity ratio and operative temperature
is not in the ASHRAE 55-2004 summer
or winter clothes region.
- Mech Vent + Nat Vent +
Infiltration - The sum of outside
air (in ac/h) flowing into the zone through:
- The HVAC air distribution system +
- Infiltration +
- Natural ventilation
The above data can be displayed at all time increments. In addition,
air, radiant and operative temperatures can be displayed as distribution
curves (below).
You can find more detailed information about Fanger, Pierce and Kansas
State University Thermal comfort prediction
algorithms in the EnergyPlus
Background Section.
The Mech Vent + Nat Vent + Infiltration
data is the sum of fresh air delivered through the HVAC system, infiltration
and natural ventilation outside airflow in air changes per hour (ac/h).
When used together with the other environmental output it can be very
useful in checking for occupant discomfort.
Note 1: It is
possible to display comfort data for occupied periods only by selecting
2-Just occupied periods as Zone
environmental and comfort reports on the Output tab of the simulation
options dialog. This option applies to all data described in this Comfort
Analysis help section.
Note 2: Comfort
data are not generated when the Gains
data model option is set to Lumped.
This is because in EnergyPlus the request for comfort calculations is
made in the 'PEOPLE' statement and this is not used with Lumped gains.
Block and Building comfort level data
The comfort data listed above is calculated for blocks using floor
area weighted averages of the zones in the block. For example:
Block average Air temperature (Ta)
= (A1 x Taz1
+ A1 x Taz2
+ A3 x Taz3
+ ...) /
(A1 + A2
+ A3 + ...)
Where:
An is floor area of zone n,
Tazn is the air temperature
of zone n
There is one exception, Mech Vent + Nat Vent
+ Infiltration, which is calculated in a similar way but using
volume-weighted averages, i.e.
using zone volumes instead of floor areas in the above equation.
Building data is calculated in the same way but including all blocks.
if the Include unoccupied zones in block and
building totals and averages option is not set then unoccupied
zones are not included in the above equation.
Note: if all
zones in the block/building are unoccupied and the option is not set the
denominator is zero and an error message is shown and results are deleted.
Temperature distribution
 Summary description
To view temperature distribution graphs follow this procedure:
- Select the Temperature distribution
option on the Output tab of the Simulation options dialog before running the simulation.
- If, as is common, you need temperature distribution data for occupied periods only, then you should select the 2-Just occupied periods option for Zone
environmental and comfort reports on the Output tab of the Simulation
options dialog, again before the simulation. Note that if you do this and the zone is always unoccupied then you won't see any output.
- Run the simulation for the period of interest. There is no need to select sub-hourly, hourly, daily or monthly output data if temperature distribution data is all you require.
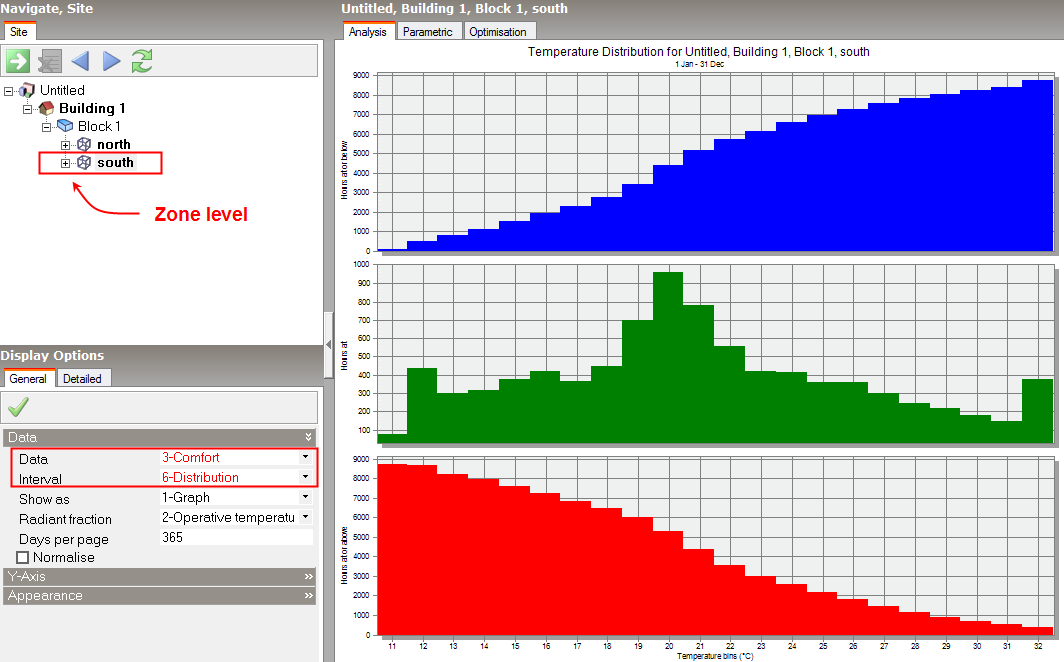
- Navigate to the zone of interest (you must be at zone level to view temperature distribution data).
- Set the Interval option in the Display Options
panel to Distribution and the Data option to Comfort
- View the temperature distribution chart.
Detailed description
If you requested Temperature distribution
data prior to the simulation, you can generate temperature distribution
curves showing 'hours at', 'hours below' and 'hours above' temperature
levels in 1°C temperature intervals during the occupied period. Bins include data for the labelled temperature through to that temperature + 1°C, so for example, the bin labelled '12°C' holds data for all temperatures in the range 12°C <= T < 13°C.
The temperature distribution result set is calculated using sub-hourly data generated during the simulation regardless of whether sub-hourly or hourly results were requested for output. You should therefore expect to see slightly different distribution results between runs if you change the timesteps per hour setting.
To
view temperature distribution data set the Interval option in the Display Options
panel to Distribution and the Data option to Comfort. This data can be useful for getting
an overview of the levels of comfort (or otherwise) provided by the building
over time. The results can be compared with benchmark comfort criteria.
For example, CIBSE provides recommended benchmark summertime peak temperatures
and overheating criteria as follows:
Offices, schools, dwellings (living areas) should have no more than
1% of the annual occupied hours over operative temperature of 28°C. Bedrooms
in dwellings should have no more than 1% of the annual occupied hours
over operative temperature of 26°C.
UK DfES Building Bulletin BB87 recommends an allowable overheating criteria
of 80 occupied hours in a year over and air temperature of 28°C.
Note 1: Temperature
distribution data is only available at zone
level.
Note 2: This data is not available when using Lumped gains model option as the data is tied in with the EnergyPlus 'People' data set and this is not generated for Lumped gains.
Note 3: This data is not available if the 1 time step per hour option is selected
Example Temperature Distribution Output
Simplified ASHRAE 55-2004 Graph Related Outputs
The Discomfort hours data
is based on whether the humidity ratio and the operative temperature is
within the region shown in ASHRAE Standard 55-2004 in Figure 5.2.1.1.
For these outputs the operative temperature is simplified to be the average
of the air temperature and the mean radiant temperature. For summer, the
0.5 Clo level is used and, for winter, the 1.0 Clo level is used. The
graphs below are based on the following tables which extend the ASHRAE
values to zero humidity ratio.
In some cases you may find a large number of discomfort hours for a
particular zone even though the air temperature in the space is within
normal ranges. If this happens you should check:
- Operative temperatures which can be very different
in highly glazed spaces in the summer or poorly insulated spaces in the
winter.
- Humidity levels are within range - you may find
very high or very low humidity caused by inadequate ventilation. Note
that the minimum comfort temperature with winter clothes when the air
is very dry is 21.7°C
/ 71°F
which may be lower than some heating temperature setpoints. Likewise in
the summer when the air is very humid operative temperatures above 26.8°C / 80.2°F are considered
too hot with summer clothes.
Winter Clothes
Summer Clothes
Note: in ASHRAE 55 comfort assessments the criteria can be exceeded, regardless of the temperature, if the relative humidity is too high.
You can also determine distributed comfort levels using CFD Comfort Calculations.
Note on discomfort hours calculations
The Discomfort hrs data displayed by DesignBuilder is similar
to the "Time Not Comfortable Based on Simple ASHRAE 55-2004" data displayed in the Summary report, but EnergyPlus uses a different method to DesignBuilder for calculating building level discomfort hours. "Time not comfortable Based on Simple ASHRAE 55-2004" is the summation of the number of hours over the year when one or more zones in the building fail the ASHRAE 55 comfort criteria. DesignBuilder on the other hand calculates discomfort hours at building level in the same way as other building average values as the floor area-weighted average of all zones.