Uncertainty and Sensitivity Analysis - Design Variables
Accessed from Parametric, Optimisation and UA/SA Analysis Settings dialog
Tip: The Edit Variables dialog should be used with caution because there is no Cancel button, so once the dialog is opened, any changes made cannot be undone and upon closing of the dialog, the variable will be saved, replacing the previous one, with the settings currently being shown on the screen. In the case where you have mistakenly added a variable (or made incorrect changes while editing an existing one) you can close the dialog and then delete the incorrect variable on the design variables tab on the main Edit Parametric, Optimisation and UA/SA Analysis Settings dialog. Alternatively if you haven't made any other changes since opening the main dialog , simply press Cancel on that dialog to lose all changes.
Design Variables
The Design variables dialog can be accessed from the Parametric, Optimisation and UA/SA Analysis Settings dialog, when 3-Uncertainty/ Sensitivity Analysis is selected on the Analysis Type Tab, after pressing Add Output or Edit Output.
Name
User defined name for the Design Variable e.g. "Window Wall %"
Variable type
Type of input Design Variable, to be selected from the browse list in the right-hand info panel.
You can view the full list of variable types on the Optimisation - Design Variables section.
Note: All variables are listed for selection regardless of the state of the model so care must be taken to select variables that are appropriate. For example, if the Scheduled natural ventilation model option is used then changes in the % External window opens variable (which only applies to Calculated natural ventilation) won't affect results.
Distribution Category
Type of probability distribution. The category can be selected form the drop-down list. The option selected here (along with analysis level on the Analysis Type tab and Variable Type above) determines the distributions curves available. There are two options:
- 1-Discrete: Available for list type variables and numeric variables.
- 2-Continuous: Available for numeric variables only.
Note: The number of options available for distribution are also controlled by Level selected on Analysis Type Tab.
 View the full explanation of Discrete and Continuous categories and their availability in simple and detailed settings.
Discrete Distributions: Distribution of the input variable that can take up only finite (or countably infinite) set of values.
Note: When a list type variable is used to modify a single numeric setting within a set of components (e.g. U-value for constructions or glazing) then it is important that the numeric values are evenly spaced in each of the components in the list to ensure meaningful regression sensitivity analysis results. For example if you wish to analyse the effect of changing wall U-value between 0.1 and 0.5 then it is recommended to use a fixed increment in U-value such as 0.1 or 0.05.
Continuous Distributions: Distribution of a random variable that may take any value in a finite or infinite set of values.
Note: If the input variable is a list type one, then it will have a discrete probability distribution. e.g. Constructions assembly options for Wall. If the variable is a numeric type one, it generally will be defined as a continuous distribution, e.g. load power densities or system CoP. However, discrete distribution can also be used for the numeric type variables e.g. Temperature setpoints limited to a discrete increment of 0.5 °C.
The table below lists the various discrete and continuous probability distribution curves available for numeric and list type variables for simple and detailed analysis levels.
|
Analysis Level
|
Variable Type: Numeric
|
Variable Type: List
|
|
Simple
|
Discrete Distributions:
- 3-Binomial
- 20-Uniform (discrete)
|
Discrete Distributions:
- 3-Binomial
- 20-Uniform (discrete)
|
|
Continuous Distributions:
- 12-Log-Normal
- 14-Normal
- 18-Triangular
- 19-Uniform
|
Continuous Distributions:
Not Applicable
|
|
Detailed
|
Discrete Distributions:
|
Discrete Distributions:
- 1-Bernoulli
- 3-Binomial
- 9-Geometric
- 10-Hyper-Geometric
- 13-Negative Binomial
- 16-Poisson
- 20-Uniform
|
- 2-Beta
- 4-Cauchy
- 5-Chi-Squared
- 6-Exponential
- 7-Fischer F
- 8-Gamma
- 11-Levy
- 12-Log-Normal
- 14-Normal
- 15-Pareto
- 17-Student T
- 18-Triangular
- 19-Uniform
- 21-Weibull
|
Continuous Distributions:
Not Applicable
|
Distribution Curve
The statistical function that describes the possible values and their likelihoods for the Design Variable. Select the distribution Curve from the drop-down list.
View the full list of all distribution curves: and links to Wikipedia Pages
|
S.No.
|
Distribution (hyperlink
to Wiki pages)
|
Category (Discrete /
Continuous
|
Analysis Level (Simple / Detailed)
|
Sample Image
|
Controlling Parameters
|
|
1
|
Bernoulli
|
Discrete
|
Detailed
|
NA
|
Probability of Second option
(Can only have 2 variable value options)
|
|
2
|
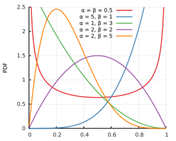
Beta
|
Continuous
|
Detailed
|
|
Left shape parameter (Alpha)
Right shape parameter (Beta)
|
|
3
|
Binomial
|
Discrete
|
Both
|

|
Number of Trials (n)
Probability (p)
|
|
4
|
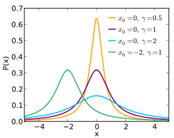
Cauchy
|
Continuous
|
Detailed
|
|
Scale Parameter
Location (Peak Value)
|
|
5
|
Chi Squared
|
Continuous
|
Detailed
|

|
Degree of Freedom
|
|
6
|
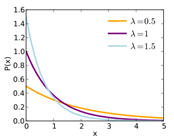
Exponential
|
Continuous
|
Detailed
|
|
Mean
|
|
7
|
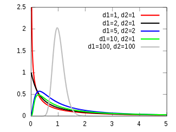
Fisher F
|
Continuous
|
Detailed
|
|
Degree of Freedom (n)
Degree of Freedom(d)
|
|
8
|
Gamma
|
Continuous
|
Detailed
|
|
Shape parameter
Scale parameter
|
|
9
|
Geometric
|
Discrete
|
Detailed
|

|
Probability (p)
|
|
10
|
Hypergeometric
|
Discrete
|
Detailed
|

|
Population size
Population Number
Sample Size
|
|
11
|
Levy
|
Continuous
|
Detailed
|
|
Min Val (Location Parameter)
Scale parameter
|
|
12
|
Log Normal
|
Continuous
|
Both
|
|
Mean
Standard Deviation
|
|
13
|
Negative Binomial
|
Discrete
|
Detailed
|
|
Number of success
Probability
|
|
14
|
Normal
|
Continuous
|
Both
|

|
Mean
Standard Deviation
|
|
15
|
Pareto
|
Continuous
|
Detailed
|

|
Shape parameter
Scale parameter
|
|
16
|
Poisson
|
Discrete
|
Detailed
|
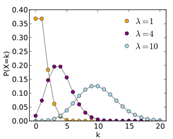
|
Mean
|
|
17
|
Student T
|
Continuous
|
Detailed
|

|
Degree of Freedom (n)
|
|
18
|
Triangular
|
Continuous
|
Both
|

|
Location (Peak Value)
Min Val
Max Val
|
|
19
|
Uniform (Continuous)
|
Continuous
|
Both
|
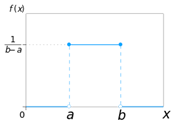
|
Min Val
Max Val
|
|
20
|
Uniform (Discrete)
|
Discrete
|
Both
|
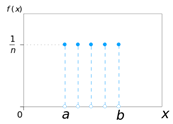
|
Min Val
Step Size
Number of Steps
|
|
21
|
Weibull
|
Continuous
|
Detailed
|
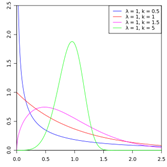
|
Shape parameter
Scale parameter
|
Distribution Parameters
Depending on distribution curve various distribution parameters are available.
View the full list of all distributions and their controllers
|
SNo.
|
Distribution
|
Parameters
|
Limitation
|
Example Case
|
Example Image
|
|
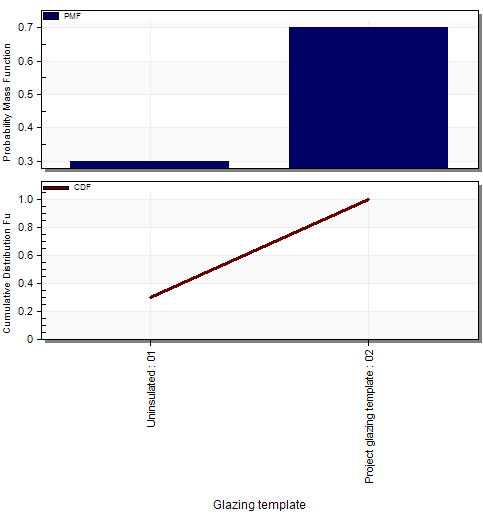
1
|
Bernoulli
|
Probability of Second option
|
Value Between 0 and 1
|
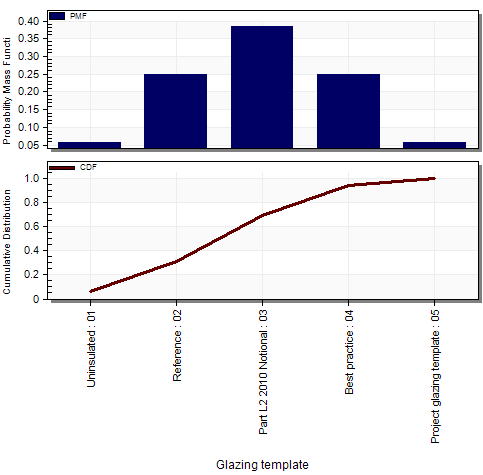
Variable: Glazing Template
Variable options selected: 2
Probability of Second option = 0.7
|
|
|
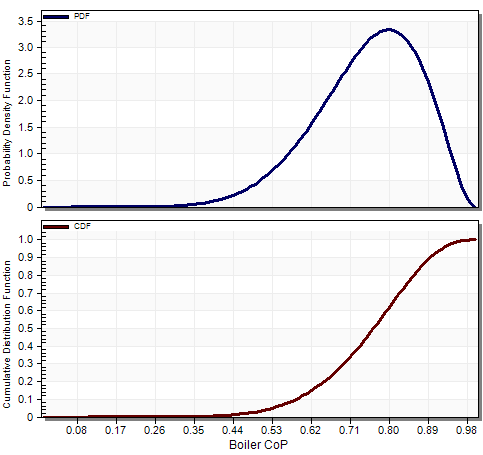
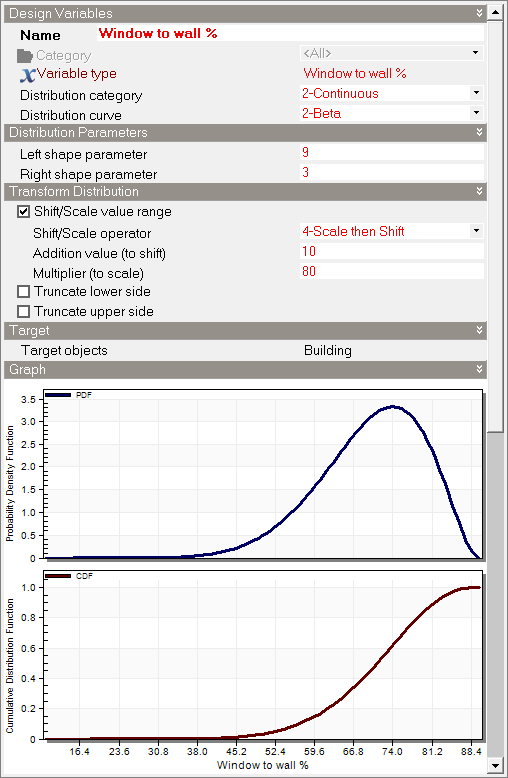
2
|
Beta
|
Left shape parameter
|
>0, Real Number, up to 50
|
Variable: Boiler CoP
Left shape parameter = 9
Right shape parameter = 3
|
|
|
Right shape parameter
|
>0, Real Number, up to 50
|
|
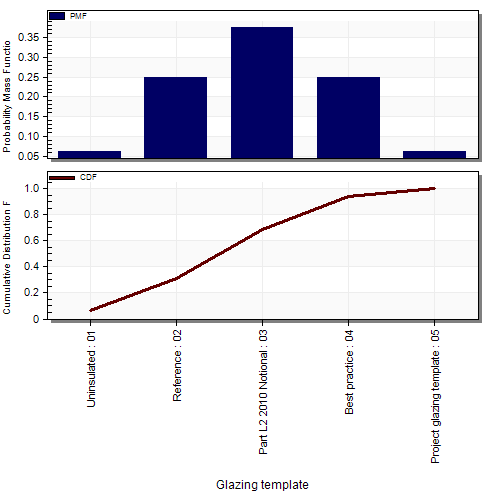
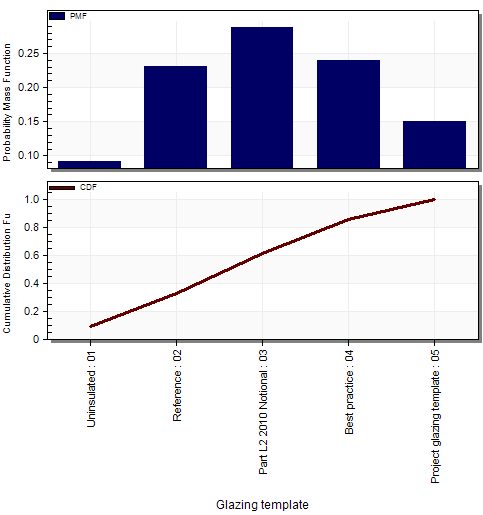
3 A
|
Binomial for List type variables
|
Probability
|
Value Between 0 and 1
|
Variable: Glazing Template
Variable options selected: 5
Probability = 0.5
|
|
|
Number of Trials
|
Locked
|
|
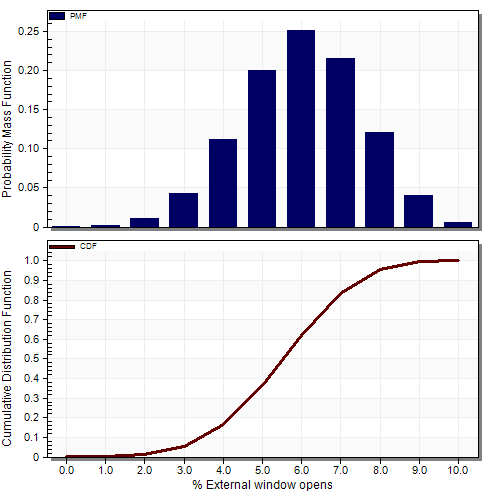
3 B
|
Binomial for Numeric type variable
|
Probability
|
Value Between 0 and 1
|
Variable: % External Window Opens
Probability = 0.6
Number of trials = 10
|
|
|
Number of Trials
|
Positive Integer
|
|
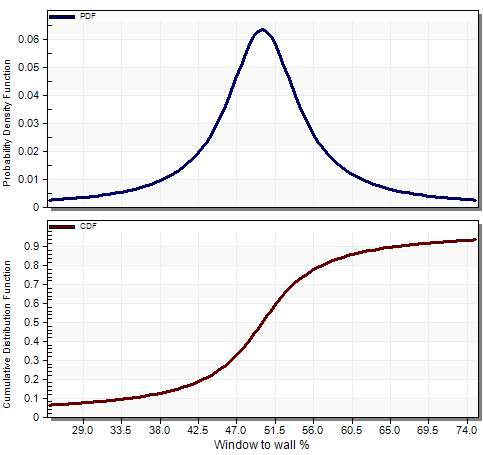
4
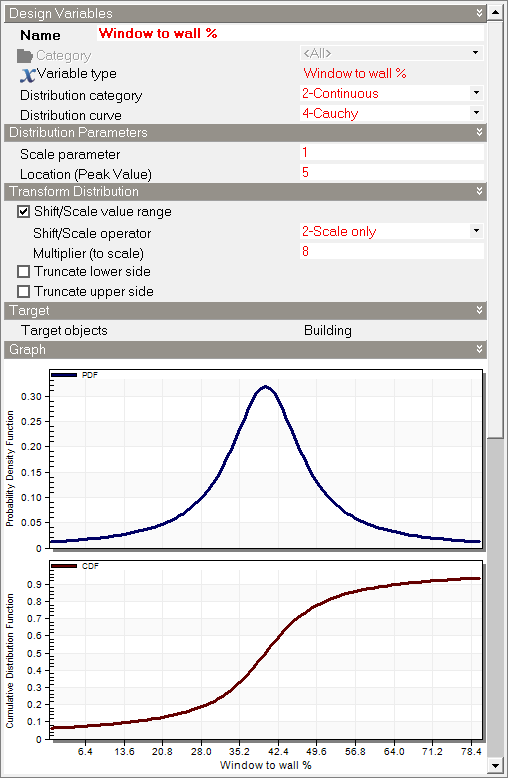
|
Cauchy
|
Scale Parameter
|
>0, Real Number up to 10
|
Variable: Window Wall %
Scale Parameter = 5
Location = 50
|
|
|
Location (Peak Value)
|
Real Number
|
|
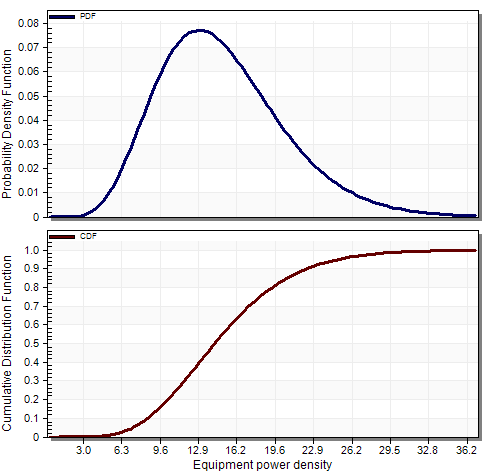
5
|
Chi Squared
|
Degree of Freedom (n)
|
Positive Integer up to 100
|
Variable: Equipment Power Density
Degree of Freedom (n) = 15
|
|
|
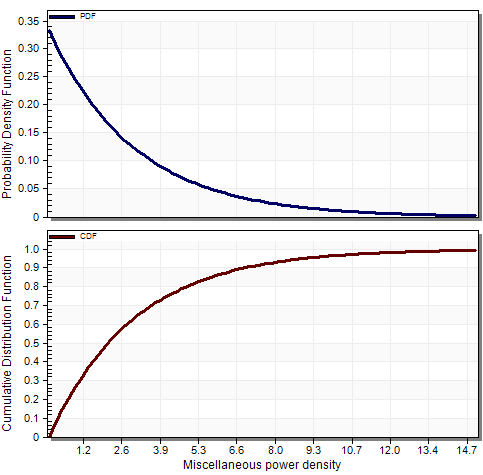
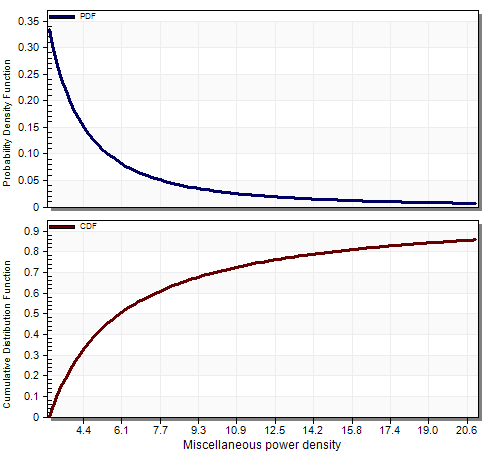
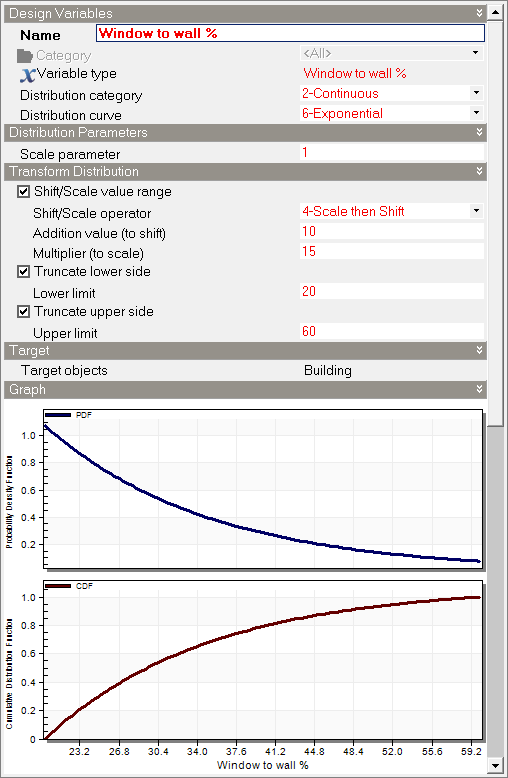
6
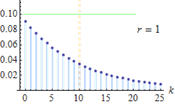
|
Exponential
|
Scale Parameter
|
>0, Real Number up to 5
|
Variable: Miscellaneous Power Density
Scale Parameter = 3
|
|
|
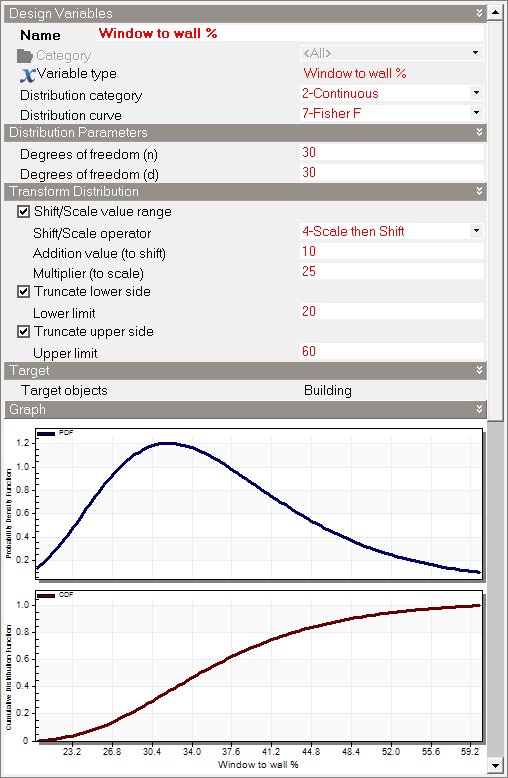
7
|
Fisher F
|
Degree of Freedom (n)
|
>0, Real Number up to 5
|
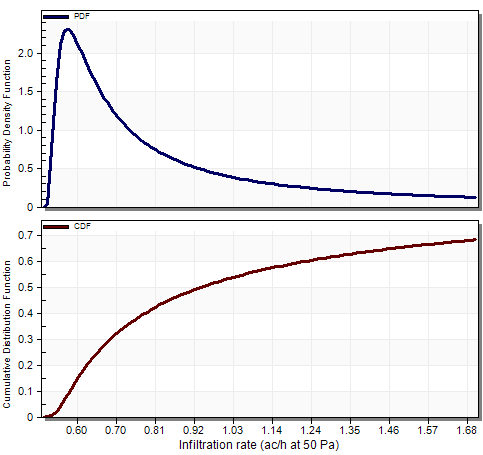
Variable: Infiltration rate
Degree of Freedom (n) = 40
Degree of Freedom (d) = 90
|
|
|
Degree of Freedom (d)
|
>0, Real Number up to 5
|
|
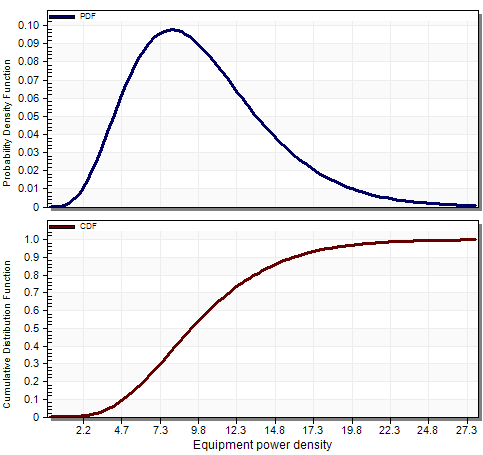
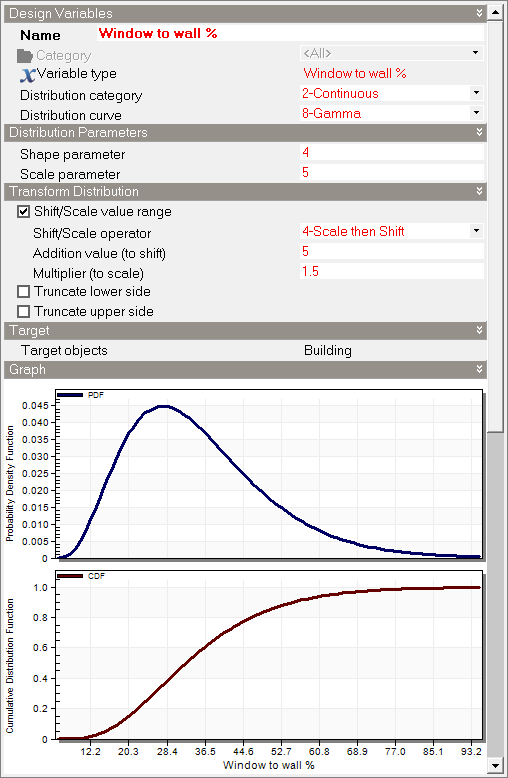
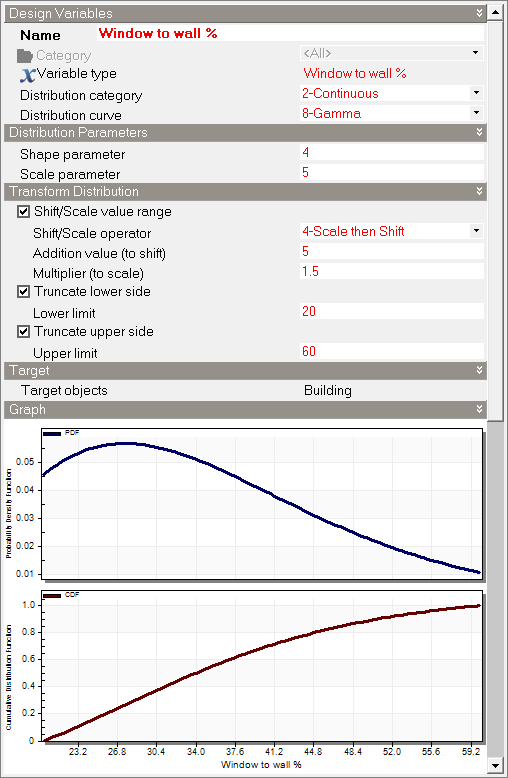
8
|
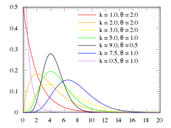
Gamma
|
Shape Parameter
|
>0, Real Number up to 20
|
Variable: Equipment Power Density
Shape Parameter = 5
Scale Parameter = 2
|
|
|
Scale Parameter
|
>0, Real Number up to 5
|
|
9
|
Geometric
|
Probability of first option
|
Value Between 0 and 1
|
Variable: Glazing Template
Variable options selected: 5
Probability of first option = 0.5
|
|
|
10
|
Hypergeometric
|
Number of trials
|
locked for list type variables
|
Variable: Glazing Template
Variable options selected: 5
No of successes = 50
|
|
|
Size of population
|
locked for list type variables
|
|
No of successes
|
Value between no of trials & (Size of population – dumber of
trials)
|
|
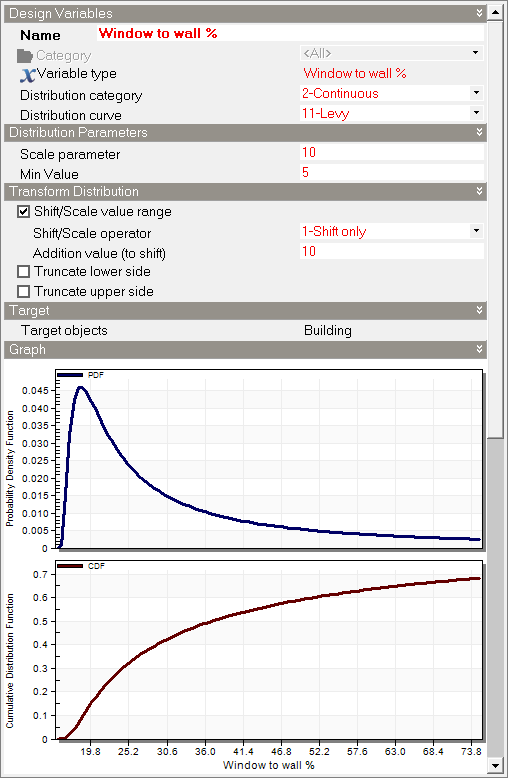
11
|
Levy
|
Scale Parameter
|
>0, Real Number up to 10
|
Variable: Infiltration rate
Scale Parameter = 0.2
Min Value = 0.5
|
|
|
Min Value
|
Real Number
|
|
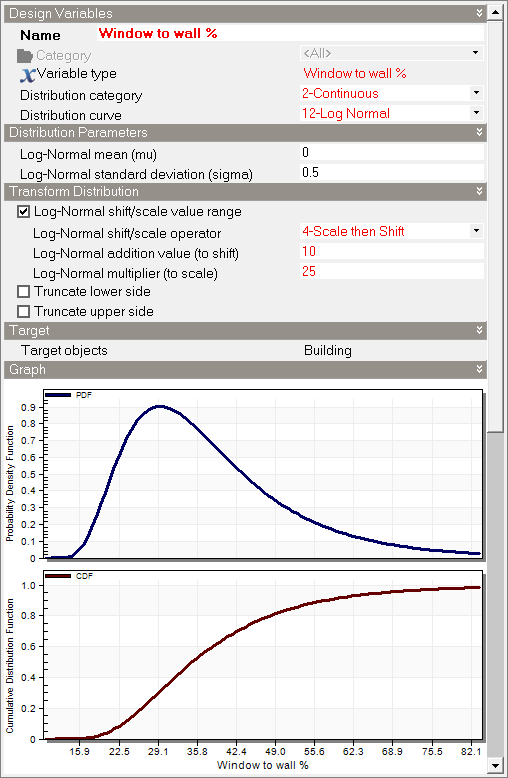
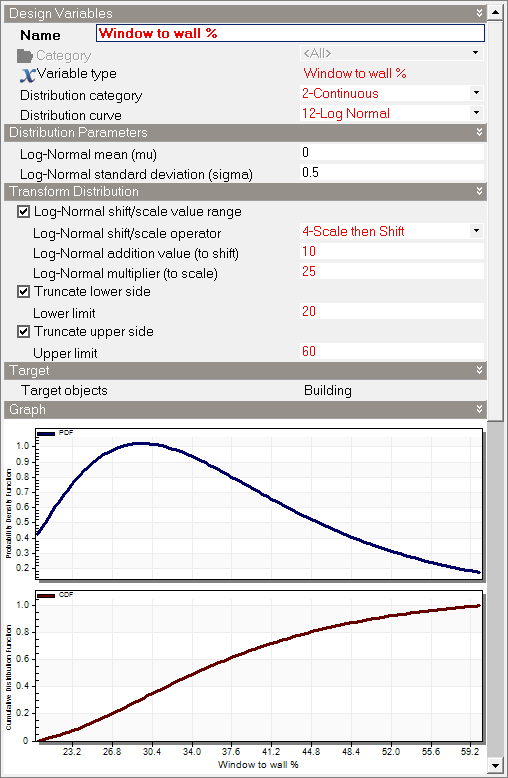
12
|
Log Normal
|
Mean
|
Real Number
|
Variable: Infiltration rate
Mean = 0
Standard Deviation = 0.5
|
|
|
Standard Deviation
|
>0 value
|
|
13
|
Negative Binomial
|
Probability
|
Value Between 0 and 1
|
Variable: Glazing Template
Variable options selected: 5
Probability = 0.5
No of trials = 3
|
|
|
No. of trials
|
Positive Integer up to 10
|
|
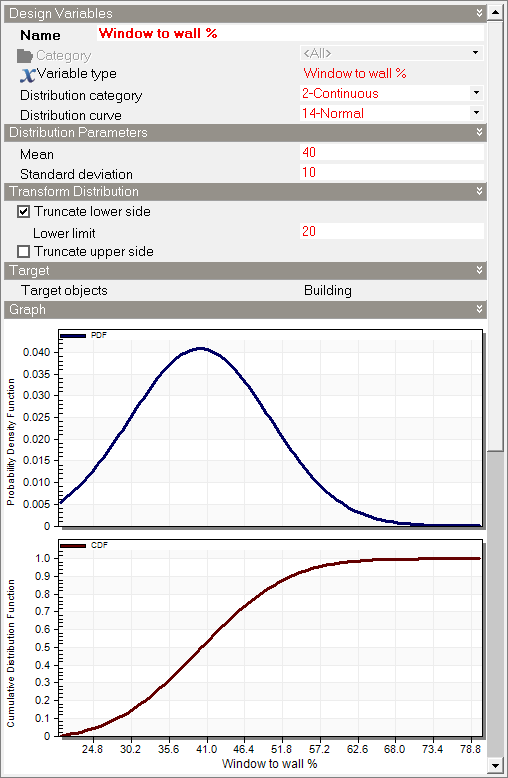
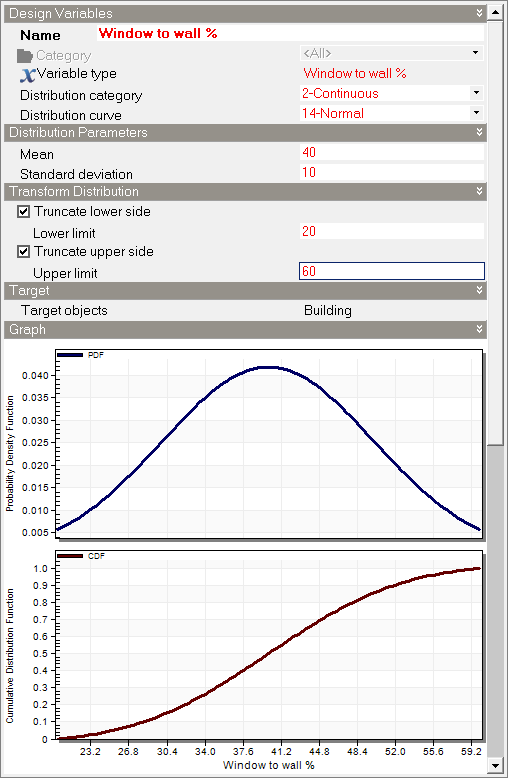
14
|
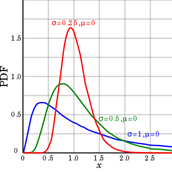
Normal
|
Mean
|
Real Number
|
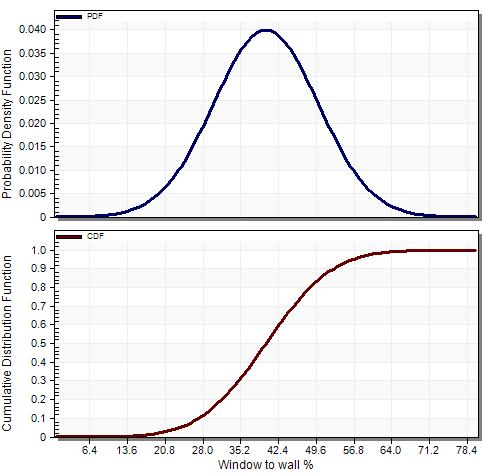
Variable: Window Wall %
Mean = 40
Standard Deviation = 10
|
|
|
Standard Deviation
|
>0 value
|
|
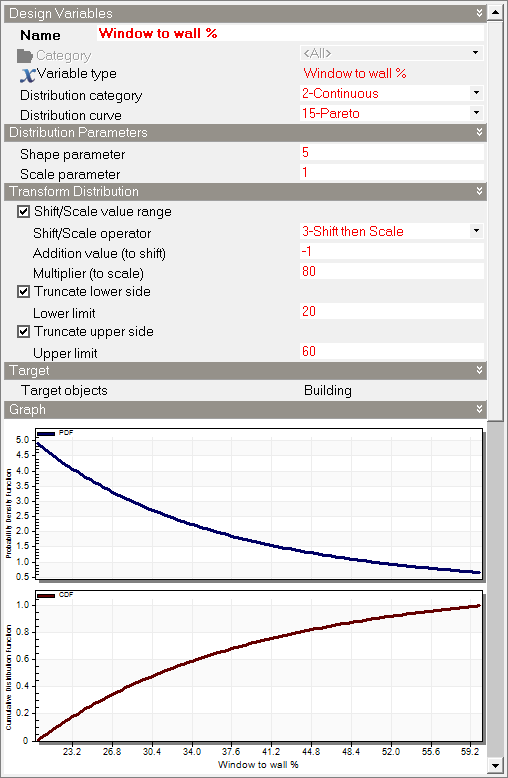
15
|
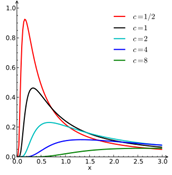
Pareto
|
Shape Parameter
|
>0, Real Number up to 50
|
Variable: Miscellaneous Power Density
Shape Parameter = 1
Scale Parameter = 3
|
|
|
Scale Parameter
|
>0, Real Number up to 50
|
|
16
|
Poisson
|
Mean
|
>0, Real Number up to 50
|
Variable: Glazing Template
Variable options selected: 5
Mean = 2.5
|
|
|
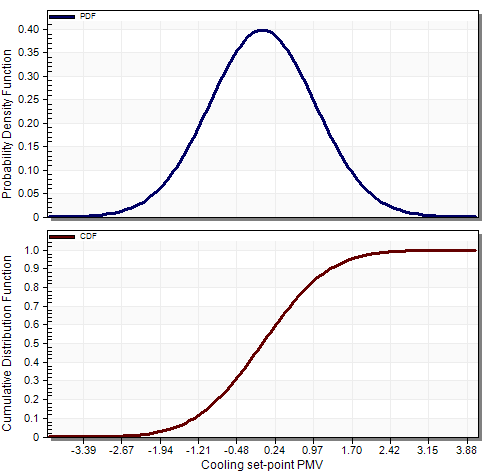
17
|
Student T
|
Degree of Freedom (n)
|
Positive Integer up to 100
|
Variable: Cooling setpoint PMV
Degree of Freedom (n) = 100
|
|
|
18
|
Triangular
|
Location (Peak Value)
|
Between Min and Max
|
Variable: Window Wall %
Location (Peak Value) = 60
Min Value = 20
Max Value = 80
|
|
|
Min Value
|
Real Number less than Max Val
|
|
Max Value
|
Real Number more than Min Val
|
|
19
|
Uniform (Continuous)
|
Min Value
|
Real Number less than Max Val
|
Variable: Window Wall %
Min Value = 20
Max Value = 80
|
|
|
Max Value
|
Real Number more than Min Val
|
|
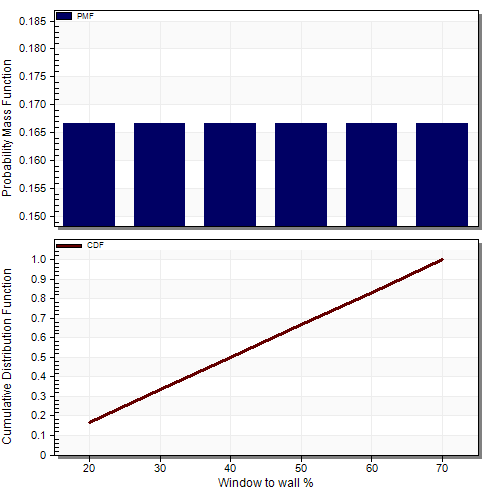
20 A
|
Uniform (Discrete) for List type variable
|
No parameters to control
|
NA
|
Variable: Glazing Template
Variable options selected: 5
|
|
|
20 B
|
Uniform (Discrete) for Numeric type variable
|
Min Value
|
Real Number less than Max Val
|
Variable: Window Wall %
Min Value = 20
Distribution Seep size = 10
Number of steps = 6
|
|
|
Max Value
|
Locked
|
|
Distribution Seep size
|
>0, Real Number
|
|
Number of steps
|
>0 Integer value
|
|
21
|
Weibull
|
Shape Parameter
|
>0, Real Number up to 50
|
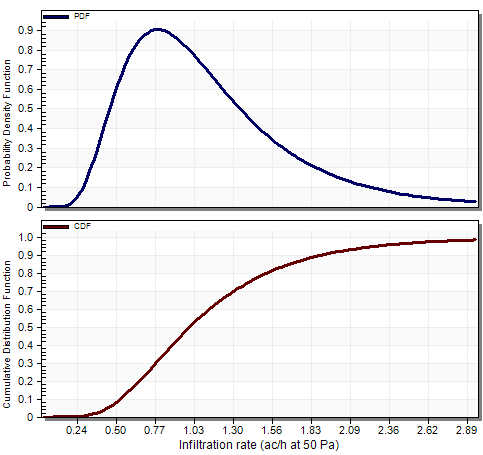
Variable: Infiltration Rate
Shape Parameter = 3
Scale Parameter = 1.25
|
|
|
Scale Parameter
|
>0, Real Number up to 50
|
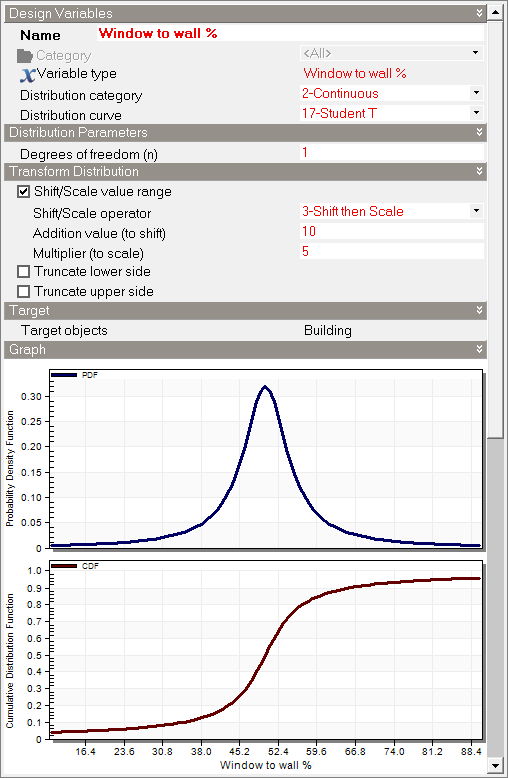
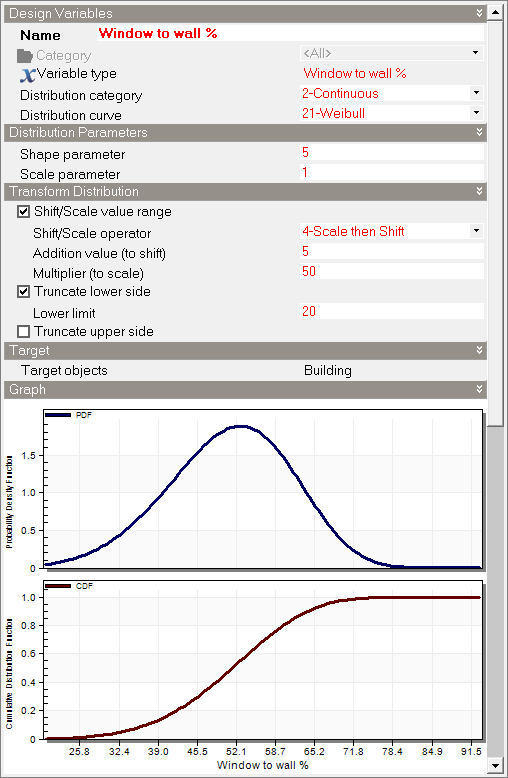
Transform Distribution
Functions under this header can be used to control the distribution curve value ranges to have more meaningful values to adapt to the variable type. This allows you to use curves whose default values are not necessarily in line with the Input Variable. These are only available for numeric distributions.
Shifting and Scaling: Depending on the operator selected, the value range of the default graph is either shifted or scaled or both.
Truncation: To avoid improbable or conflicting values being sampled, truncation can be used to remove the tales of the distribution.
Shift/Scale Value Range
Operator
There are 4 Options:
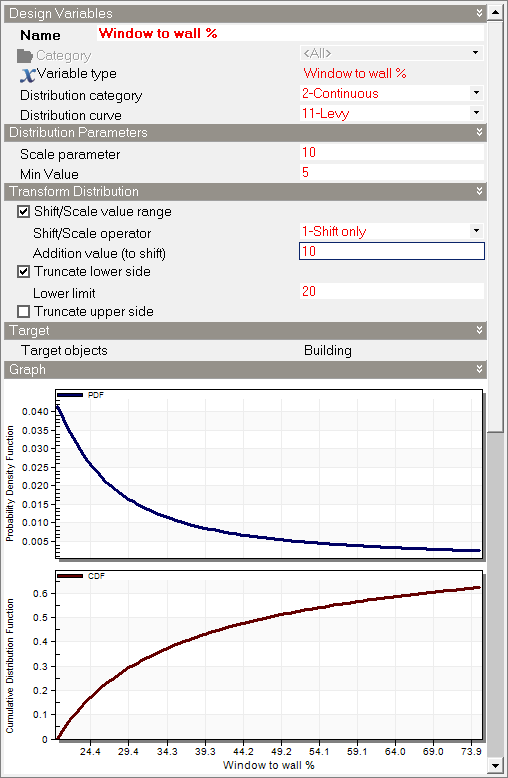
- 1-Shift only: adds Shift value to each untransformed distribution (x+a)
- 2-Scale only: multiplies scale value to each untransformed distribution (x*b)
- 3-Shift then Scale: adds Shift value and then multiplies scale value to each untransformed distribution (x+a)*b
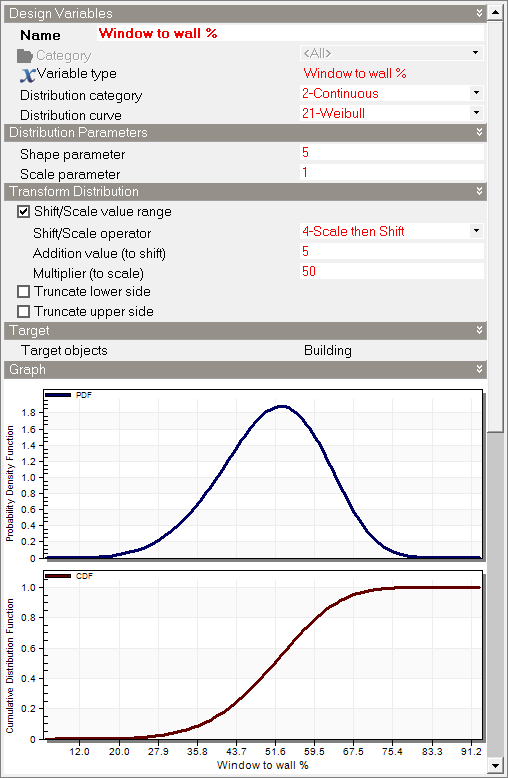
- 4-Scale then Shift: multiplies scale value and then adds Shift value to each untransformed distribution (x*b)+a
Shift value
Enter the value which is added to the default distribution’s numbers.
Note: When using IP units, for variables with units, the shifting of the distribution is controlled by a shift slider. The values can be increased or decreased by moving the slider right or left respectively. The effect of the shift slider setting on the distribution should be checked by looking at the graph at the bottom of the dialog. See screenshot under Scale value below.
Scale value
Enter the value which is multiplied to the default distribution’s numbers.
Note: When using IP units, for variables with units, the scaling of the distribution is controlled by a scale slider. The graph values scale up or down on moving the slider right or left respectively. The effect of the scale slider setting on the distribution should be checked by looking at the graph at the bottom of the dialog.
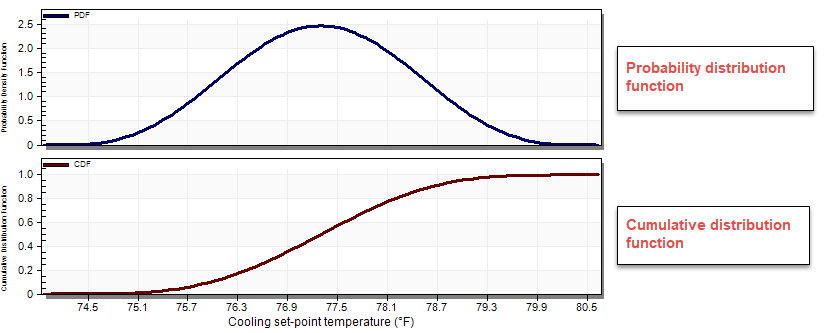
The screenshot below illustrates a case where cooling setpoint temperature distribution is controlled using the Beta distribution with slider controls and lower and upper truncation when using IP units.
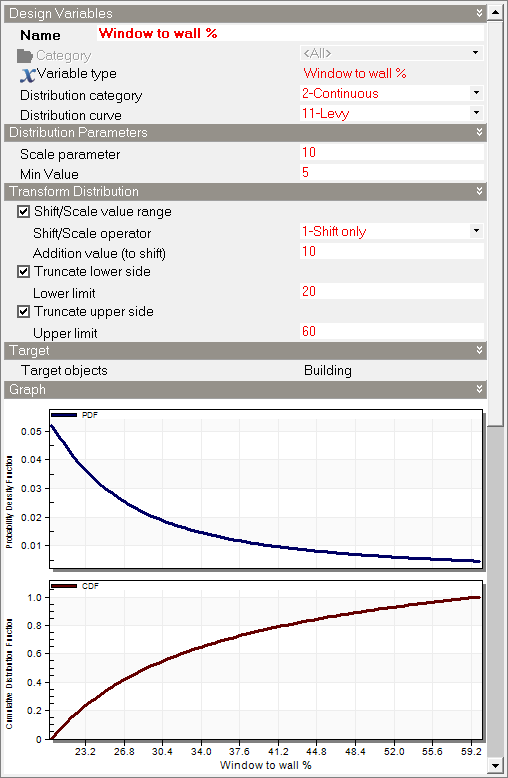
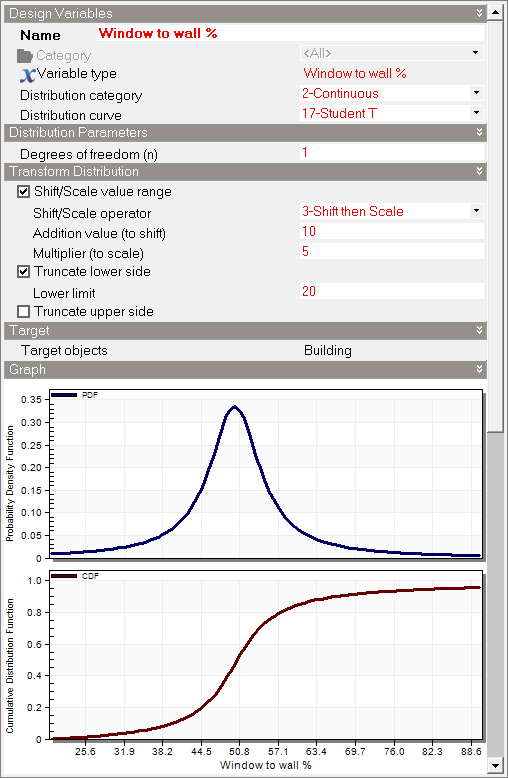
Truncate Lower side
Limit:
This value removes all the variable values below this number. In this case the probability which is removed is redistributed across the remaining curve. The value should be more than the minimum value in the untruncated graph and less than truncation upper side limit.
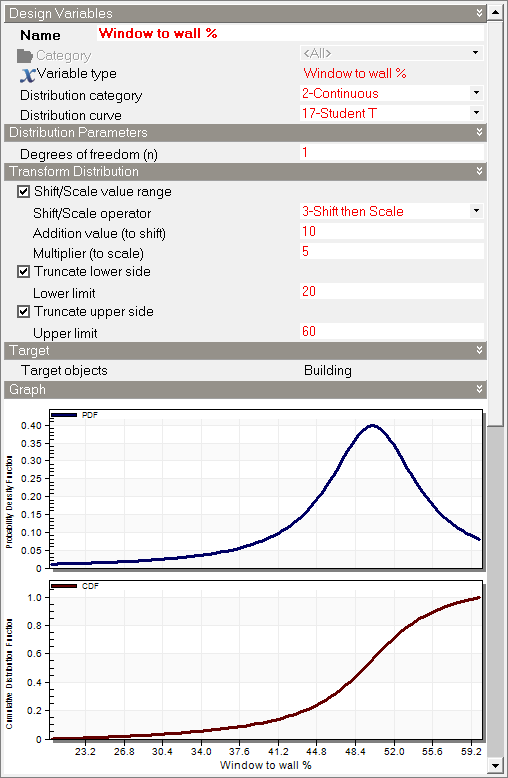
Truncate Upper side
Limit:
This value removes all the variable values above this number. In this case the probability which is removed is redistributed across the remaining curve. The value should be less than the maximum value in the untruncated graph and more than the truncation lower side limit.
The value should be less than the maximum value in the untruncated graph and more than the truncation lower side limit.
View the full list of all distributions and transformations available
|
|
Distribution
|
Transformations available
|
Example Image
|
|
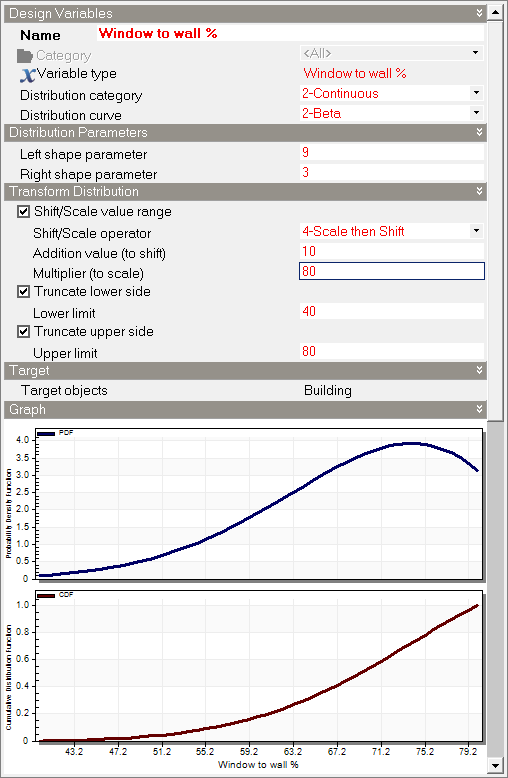
2
|
Beta
|
Shift/Scale
|
|
|
Truncate Lower Side
|
|
|
Truncate Upper Side
|
|
|
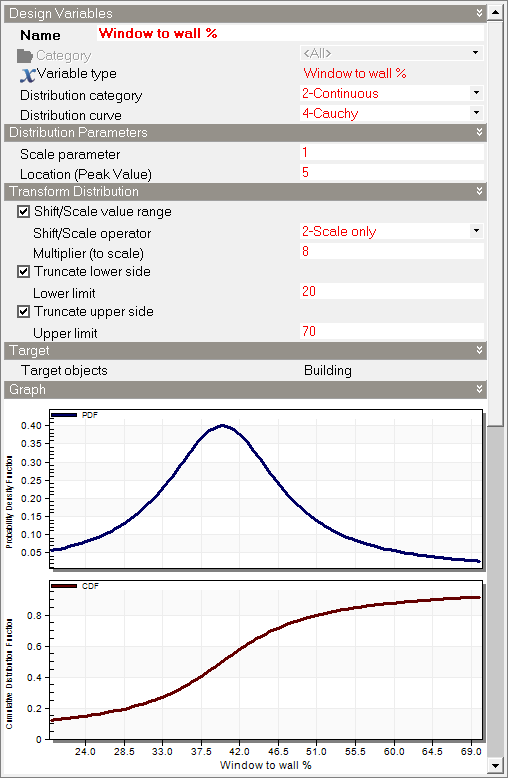
4
|
Cauchy
|
Shift/Scale
|
|
|
Truncate Lower Side
|
|
|
Truncate Upper Side
|
|
|
5
|
Chi Squared
|
Shift/Scale
|
|
|
Truncate Lower Side
|
|
|
Truncate Upper Side
|
|
|
6
|
Exponential
|
Shift/Scale
|
|
|
Truncate Lower Side
|
|
|
Truncate Upper Side
|
|
|
7
|
Fisher F
|
Shift/Scale
|
|
|
Truncate Lower Side
|
|
|
Truncate Upper Side
|
|
|
8
|
Gamma
|
Shift/Scale
|
|
|
Truncate Lower Side
|
|
|
Truncate Upper Side
|
|
|
11
|
Levy
|
Shift/Scale
|
|
|
Truncate Lower Side
|
|
|
Truncate Upper Side
|
|
|
12
|
Log Normal
|
Shift/Scale
|
|
|
Truncate Lower Side
|
|
|
Truncate Upper Side
|
|
|
14
|
Normal
|
Truncate Lower Side
|
|
|
Truncate Upper Side
|
|
|
15
|
Pareto
|
Shift/Scale
|
|
|
Truncate Lower Side
|
|
|
Truncate Upper Side
|
|
|
17
|
Student T
|
Shift/Scale
|
|
|
Truncate Lower Side
|
|
|
Truncate Upper Side
|
|
|
18
|
Triangular
|
N/A
|
|
|
19
|
Uniform (Continuous)
|
N/A
|
|
|
21
|
Weibull
|
Shift/Scale
|
|
|
Truncate Lower Side
|
|
|
Truncate Upper Side
|
|
Warning when changing from SI to IP units: If any variables that were defined in SI units are edited, the transformations (shifting/scaling and truncations) will be reset.
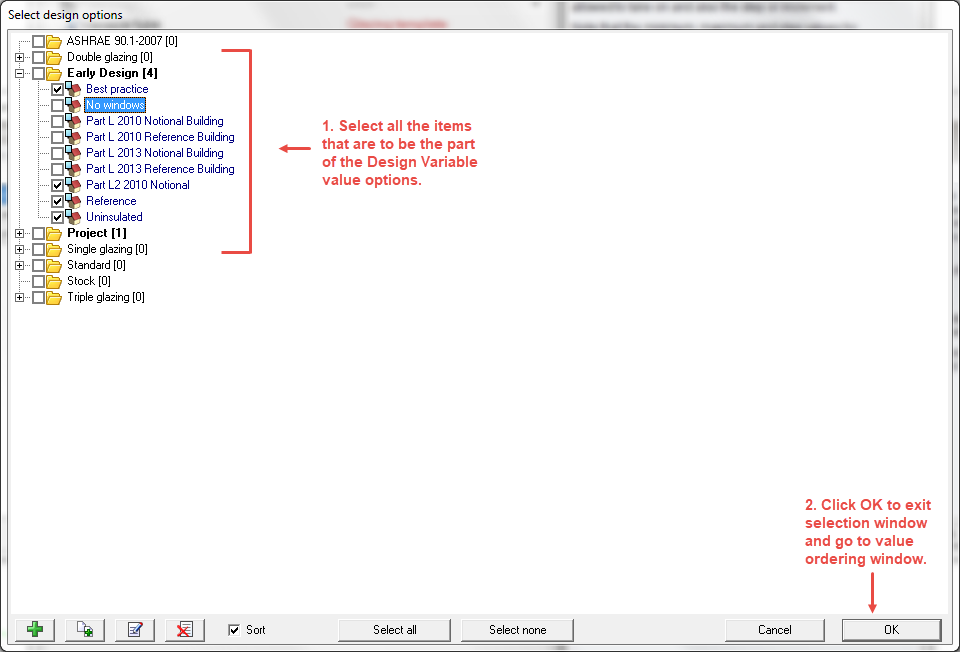
Variable Values
Options list
The Options list is only available for list type variables. It allows you to select non-numeric options and create a list of various variables that will be sampled from during the UA/SA.
Click on the browse button to open a list of components or templates for selection. In the new Select design option window, items can be selected by checking the appropriate checkboxes.
The number of items selected form the discrete distribution’s items and truncates the distributions selected (if required).
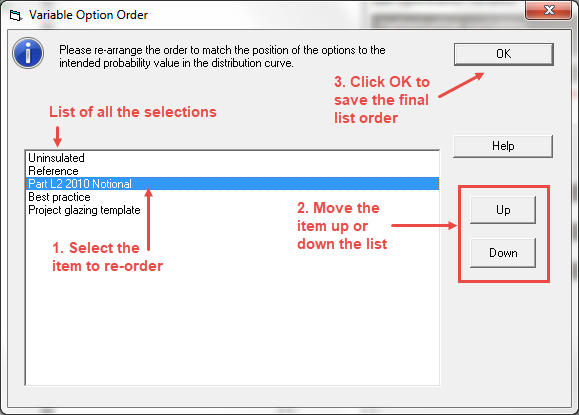
After selecting the options, it is important to order the list, to match the unintended probability values of each of the section. This is done in the Variable Option Order dialog which is automatically displayed after adding/editing a list of variable options.
Important Note: The selection order must be set up to ensure that SA can assess the effect of incremental changes to values of the selected options on the main output of interest. For example, if the variable is wall construction with each construction having a different U-value (perhaps by varying insulation thicknesses), and if building heating energy is the SA output, then the constructions should be ordered based on (increasing or decreasing) U-value . This is because U-value is the construction attribute that has the greatest influence on heating energy. If you do not take care to order option lists in this way, then the SA results will not be meaningful. See also: Running Sensitivity Analysis as a Precursor to Optimisation.
Target
Target objects
This setting allows you to select one or more object(s) to which the variations are to be applied. The object(s) you select here are the places in the model where the variations will be applied. Normal model data inheritance rules apply so if you set the building as the target then the change will set for the building but will also inherit down to block, zone, surface and opening levels where appropriate. In this case any hard-set data at block or lower levels will prevent inheritance in the normal way.
Tip: For models imported via gbXML any construction or glazing assignments are set in the DesignBuilder model at surface level and so the normal inheritance paths used for construction and glazing will be overriden. Therefore in this case, if you need to parametrically adjust construction or glazing surface properties you may need to apply the changes to each surface individually by selecting the appropriate surfaces as targets.
Graph
This is the visual representation of the probability curve and shows the probability distribution curve/ probability mass curve and cumulative distribution curve. To update the graph to display the current settings click on the Create/Update Graph button.