Condensation analysis tab on Constructions Dialog.
DesignBuilder Condensation Analysis allows you to generate reports on the occurrence of interstitial and surface condensation based on the ISO 13788 standard.
The analysis is accessed from the Condensation analysis tab on the Constructions dialog. Controls are provided under the Options header to control the outputs generated and there are also tools to allow you to set internal and external boundary conditions for the condensation calculations.
Note: The moisture vapour resistance properties for each material used in the construction layers must be entered on the materials dialog for accurate condensation analysis results.
Data under the Options header allows you to set various calculation and display options for the condensation analysis.
Check this option if you would like to view a Glaser diagram showing a graphical section through the construction with temperature, partial vapour pressure and saturated vapour pressure data plotted.
Month
When viewing a Glaser diagram select the month from the drop list. The default option is 13-Worst case month where DesignBuilder displays results for the month with the worst case of moisture build up.
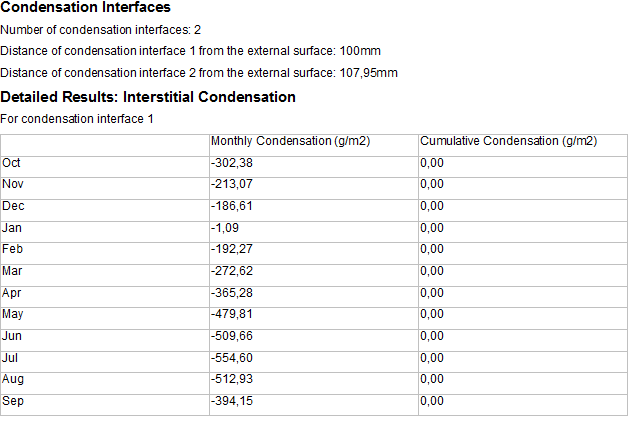
If you would like to view details of the monthly and cumulative condensation build up for each interface with condensation then check this option. In this case, if condensation is present you will see output similar to:
Interface
If you requested interstitial condensation details then you should enter the interface number here. The definition of each interface with condensation is given under the Condensation Interfaces heading in the report.
To see surface condensation details check this box. In this case you should enter further details to define the boundary conditions as explained below.
Environment source
Select from:
- 1-Maintained internal environment, where you can enter fixed values for internal air and RH
- 2-Maintained internal air temperature,
- 3-Boundary data,
In all cases monthly external conditions are defined in the Boundary data.
Fixed internal air temperature
Enter the constant internal air temperature for the Surface condensation calculation.
Fixed internal RH
Enter the constant internal relative humidity for the Surface condensation calculation.
Humidity class
Enter the humidity class for the Surface condensation calculation. The allowed classes are as follows:
Humidity Class Building Type 1 Storage areas 2 Offices, shops 3 Dwellings with low occupancy 4 Dwellings with high occupancy, sport halls, kitchens, canteens; buildings heated with un-flued gas heaters 5 Special buildings Show surface condensation details
Check the Show surface condensation details checkbox to display a table similar to the one below in the report.
Ext Temp
Ext RH (%)
Int Temp
Int RH (%)
Min Temp Factor
Min Tsi
Tsi
Jan
3.9
85
20.0
50
0.633
14.1
19.3
Feb
3.9
82
20.0
50
0.633
14.1
19.3
Mar
5.7
79
20.0
50
0.586
14.1
19.3
Apr
8.0
75
20.0
50
0.507
14.1
19.5
May
11.3
73
20.0
50
0.320
14.1
19.6
Jun
14.2
75
20.0
50
-0.020
14.1
19.7
Jul
15.8
75
20.0
50
-0.408
14.1
19.8
Aug
15.7
77
20.0
50
-0.375
14.1
19.8
Sep
13.5
80
20.0
50
0.090
14.1
19.7
Oct
10.6
83
20.0
50
0.371
14.1
19.6
Nov
6.4
85
20.0
50
0.565
14.1
19.4
Dec
4.6
86
20.0
50
0.616
14.1
19.3
An example report generated by the Condensation analysis tool is shown below.
Condensation Analysis Report
Interstitial Condensation
Interstitial condensation occurs at one or more interfaces but all condensate is predicted to evaporate during the summer months.
The risk of degradation of building materials and deterioration of thermal performance as a consequence of the calculated maximum amount of moisture shall be considered according to regulatory requirements and other guidance in product standards.
Condensation Interfaces
Number of condensation interfaces: 2
Distance of condensation interface 1 from the external surface: 100mm
Distance of condensation interface 2 from the external surface: 108.333333333333mm
Surface Condensation
Thermal quality Good. Mould growth unlikely.

Note: In some cases the constructions layers are displayed in the Glaser diagram as being compressed together. To understand this consider that Glaser diagrams use the concept of "equivalent thickness of air" on the X-axis. This defines the amount of resistance to moisture diffusion relative to the equivalent thickness of air. When layers are compressed together this means that they offer little resistance to moisture diffusion. For example if a layer has an equivalent thickness of 5m that means that it offers the same diffusion resistance as 5m of air. It is usual for materials with high diffusion resistance to be used on the warm side and with lower diffusion resistance on the cold side to minimise the risk of interstitial condensation occurring. It is also important to note that the correct moisture resistance data has been entered for each of the material layers included in the construction before using the Glaser diagram and report for project work.
The Boundary data dialog can be accessed from the link on the info panel of the Condensation analysis tab. It allows the average monthly internal and external air temperature and relative humidity (RH) to be entered through a grid user interface as shown below.
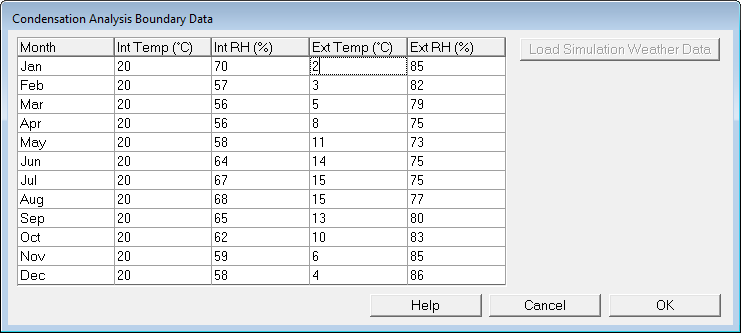
The default external conditions come from CIBSE Guide A7, but they should be updated to reflect the actual local conditions.
You can load monthly external air temperature and RH values from the current site simulation weather data by clicking on the Load Simulation Weather Data button. Note that this is only enabled when site data has been loaded on the Simulation screen. The easiest way to achieve this if a simulation hasn't been run is to go to the Simulation screen, navigate to site level and press the Update toolbar icon.
The same condensation boundary data is stored for later use with this or other constructions.
