This tutorial demonstrates how to find the optimum set of heating and natural ventilation system control set point temperatures that simultaneously minimise Fanger PPD discomfort and heating load across the whole building. Because EnergyPlus does not include a suitable whole building comfort PPD metric a Custom EMS script is written to generate a "Percentage Discomfort Area" output for each simulation to characterise the overall degree of discomfort for all zones in the building. When combined with a Custom Script KPI it can be used as a design objective in the optimisation.
The EMS script calculates the overall building "Percentage Discomfort Area" at each timestep of the simulation (during occupied periods only) by summing the floor area of uncomfortable zones having Fanger PPD < 20% and dividing by the total floor area. The % discomfort area is averaged over the year as a single value for the building which is read and processed in a Custom KPI script written in Python. The Python KPI script uses the db_eplusout_reader library provided with DesignBuilder to read and process the comfort EMS output from the SQL simulation output file and feeds the result back to DesignBuilder after each simulation to process.
Optimal settings for heating and natural ventilation setpoints are identified that provide the lowest heating loads while also minimising PPD discomfort levels.
The main learning point is to understand the process used to generate a custom output from an EnergyPlus simulation using EMS and use it as a KPI to identify optimum design parameters.
1. Create a new model located at London Gatwick.
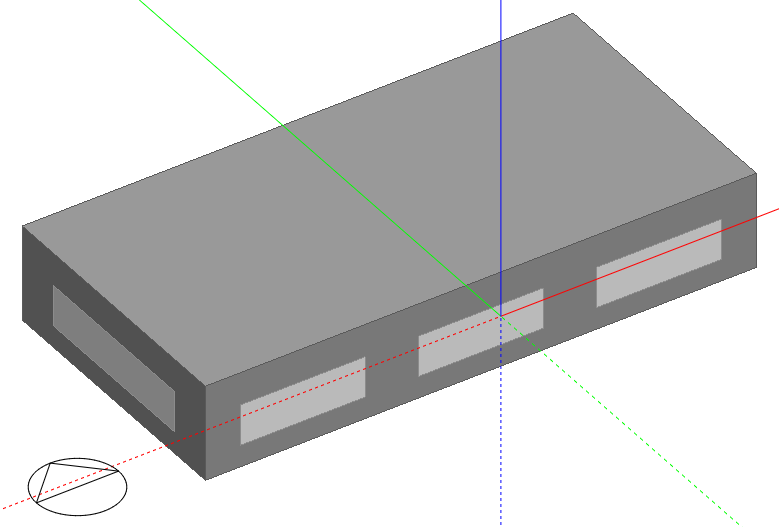
2. Add a building using default settings and draw a rectangular block measuring 40m by 20m with block height of 3.5m as shown below.
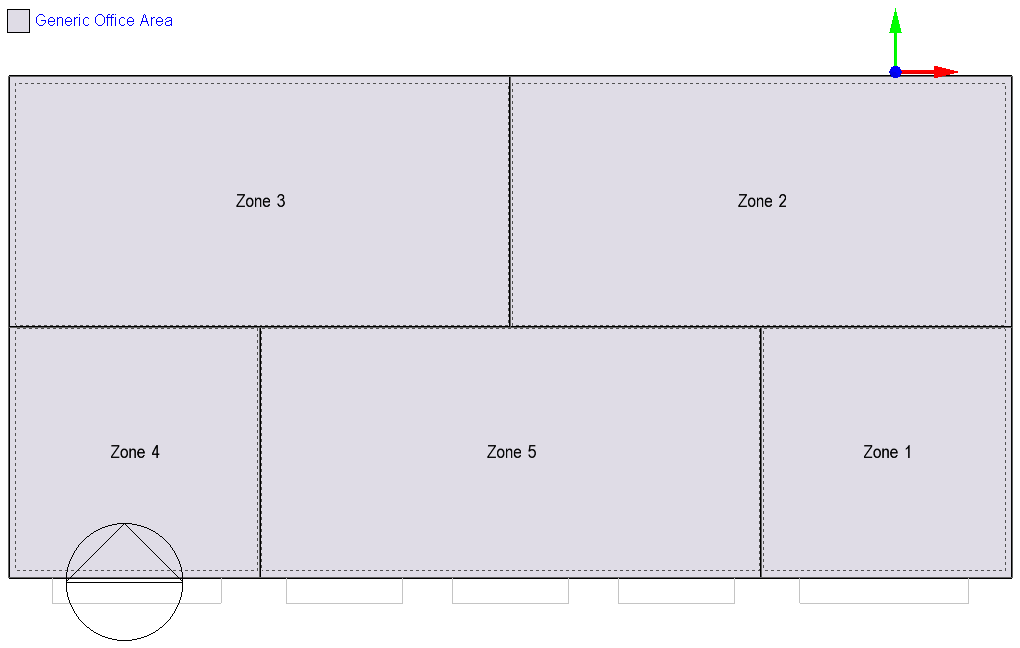
3. Sub-divide the block into several zones as follows. The SE and SW-facing corner zones both have 10 x 10m floor area. For the purposes of this tutorial the objective is to create zones that will overheat to varying degrees over the course of hot days. The exact layout is not particularly important:
4. Open the Model options dialog:
Select the Calculated natural ventilation option.
Select a (relatively high) 10 Timesteps per hour option since we are interested in the interaction of the heating and venting setpoint temperatures and it is a Calculated natural ventilation model.
Select the Fanger output option since we will be reading the base PPD results generated by EnergyPlus.
5. On the Activity Tab at building level:
Load the Generic Office Area Activity template (this is usually the default so you probably won't need to follow this step).
Select the 8:00 - 18:00 Mon - Fri occupancy schedule which can be found under in <General> category listing. This is selected because the default office occupancy schedule includes some low level occupancy after the office heating schedule has switched off at the end of each day (to account for cleaning) and this change ensures that we don't test for discomfort during times when the heating is not switched on.
6. On the Openings tab at building level:
Switch on Window shading and use the default Blind with high reflectivity slats option.
Set the % Glazing area opens to 50%.
8. On the Lighting tab load the LED with linear control Lighting template.
9. On the HVAC tab:
Load the HW Convectors, Nat Vent HVAC template.
Select the Winter heating (Northern Hemisphere) Heating Operation schedule which can be found under in <General> category listing.
Switch on the Modulate opening areas Natural ventilation option to reduce window opening areas during periods requiring heating to reduce the chances of simultaneous heating and venting.
Click on the Simulation tab and run a set of simulations to check the operation of the nat vent system to make sure you understand how it works in practice. You will probably want to run simulations for at least summer design, summer typical and winter design weeks looking at hourly or sub-hourly results to give the clearest picture of building behaviour. Does it maintain adequate comfort during the summer? Is the air change rate excessive at any point? Do you see any simultaneous heating and venting? Make any adjustments to the model and repeat this step until you are satisfied with the base model hourly results.
1. Open the Parametric, Optimisation and UA/SA Analysis Settings dialog by clicking on the  toolbar icon and set the Analysis type on the Analysis tab to 2-Optimisation.
2. Go to the Objectives tab and add 2 new objectives for comfort and heating load. You can either edit the existing objectives or first delete those and create 2 new objectives. The steps involved are described below.
To create the "Minimise Discomfort > 20% PPD" objective, a new Summary Output (aka KPI) must first be created. Click on the Objective KPI to open the list of existing Summary Outputs in the Info panel. Our custom KPI won't be listed there at first, so create it now by clicking on the existing Custom Script Summary Output on the list of KPIs, click on the Create copy of highlighted item Info toolbar icon and edit the clone. Make the following settings on the Summary Output dialog.
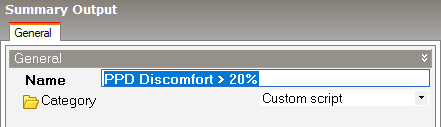
Note: The "PPD Discomfort > 20%" name entered here on the Summary Outputs dialog must match the name given in the custom KPI script described below. You may like to copy the name and paste it somewhere safe where you can easily access it later when writing the script.
Save the newly created KPI and select it on the Optimisation Objectives dialog.
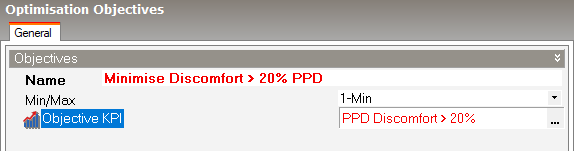
Name the objective "Minimise Discomfort > 20% PPD". That name is for your own reference only and unlike the Summary Output name, does not need to match anything else. Select the 1-Min Min/Max option to say that you wish to minimise discomfort. The dialog should now look something like the screenshot below.
Now create the Heating load objective. This is straightforward as we can use a standard built-in KPI.
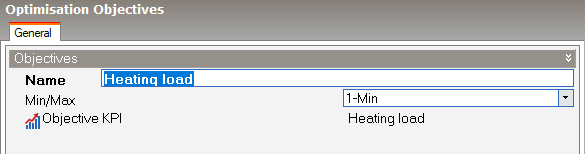
Select the Heating load KPI and call the objective "Heating load". Select the 1-Min Min/Max option to say that you wish to minimise it. The objectives dialog should now look like the screenshot below.
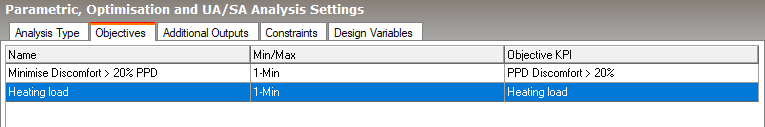
With both objectives defined, the Objectives tab should now be set up like this:
Now set up the design variables. The variables to be included are:
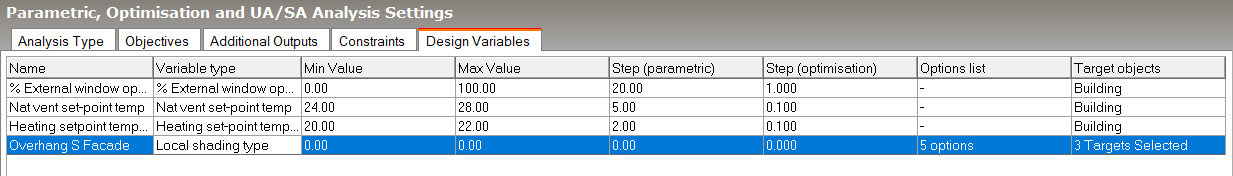
% External window opens - ranging from 0 to 100% with an optimisation step of 1.
Local shading with the 5 overhang lengths ranging from 0 to 2m in length. This is the default selection when choosing Local shading as the variable. The overhangs are applied only to the South facing surfaces: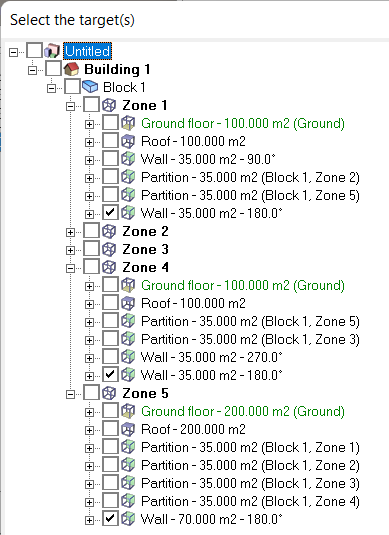
With the above variables defined, the Variables tab should now look like this:
The EMS script to be used in this example is provided below. Follow the steps below to set it up for the analysis.
1. Click on the Scripts  toolbar icon to open the Script Manager dialog and click on the Enable scripts checkbox.
2. Click on the Script browse item. A list of the existing scripts appears in the Info panel to the right.
3. Open the EMS category and click on the Add new item toolbar icon to create a new script.
4. Enter the name as "Fanger % Discomfort Area",
5. Enable the program
6.Copy the script below and paste it in the script text area.
Now check you understand how the EMS script works.
The script sets up a sensor for each occupied zone in the model to get a reading for the Fanger PPD. This is checked at the end of each zone timestep during occupied periods and compared against the threshold of 20%. If the % PPD is higher than the comfort threshold the whole zone is considered to be uncomfortable and its floor area is added to the total. The total uncomfortable floor area is divided by the total floor area of all occupied zones to give the floor-area-weighted % discomfort for the building. The timestep % discomfort outputs are averaged over the whole simulation to create a single discomfort metric which is reported as "Percentage Discomfort Area" in the SQL output file.
<ForAllOccupiedZones>
EnergyManagementSystem:Sensor,
<LoopZoneVariableName>OccSchedule_PPD,
<LoopZoneAttribute OccupancySchedule>,
Schedule Value;
EnergyManagementSystem:Sensor,
PPD_<LoopZoneVariableName>,
PEOPLE <LoopZoneIDFName>,
Zone Thermal Comfort Fanger Model PPD;
EnergyManagementSystem:InternalVariable,
Area_<LoopZoneVariableName>,
<LoopZoneIDFName>,
Zone Floor Area;
<LoopNextZone>
EnergyManagementSystem:ProgramCallingManager,
Fanger PPD Discomfort Area,
EndOfZoneTimestepBeforeZoneReporting,
FangerDiscomfortArea;
EnergyManagementSystem:GlobalVariable,
PercentageDiscomfortArea;
EnergyManagementSystem:OutputVariable,
Percentage Discomfort Area [%],
PercentageDiscomfortArea,
Averaged,
ZoneTimeStep;
EnergyManagementSystem:Program,
FangerDiscomfortArea,
SET SumNumerator = 0,
SET SumDenominator = 0,
<ForAllOccupiedZones>,
IF <LoopZoneVariableName>OccSchedule_PPD > 0.25,
IF PPD_<LoopZoneVariableName> > 20,
SET SumNumerator = SumNumerator + Area_<LoopZoneVariableName>,
ENDIF,
SET SumDenominator = SumDenominator + Area_<LoopZoneVariableName>,
ENDIF,
<LoopNextZone>
IF SumDenominator > 0,
SET PercentageDiscomfortArea = (SumNumerator / SumDenominator)*100,
ENDIF;
! provide outputs based on DB output settings
<If BuildingAttribute TimesteplyOutput = 1 Then>
Output:Variable, *, Percentage Discomfort Area, timestep;
<Endif>
<If BuildingAttribute HourlyOutput = 1 Then>
Output:Variable, *, Percentage Discomfort Area, hourly;
<Endif>
<If BuildingAttribute DailyOutput = 1 Then>
Output:Variable, *, Percentage Discomfort Area, daily;
<Endif>
<If BuildingAttribute MonthlyOutput = 1 Then>
Output:Variable, *, Percentage Discomfort Area, monthly;
<Endif>
Output:Variable, *, Percentage Discomfort Area, RunPeriod;
The next task is to write the script that will read the EMS "Percentage Discomfort Area" simulation outputs from the SQL output file, process them and pass back to DesignBuilder as a Custom KPI. Steps are as follows.
1. Click on the Scripts toolbar icon to open the Script Manager dialog. The Enable scripts checkbox should already be checked.
2. Click on the Script browse item. A list of the existing scripts appears in the Info panel to the right.
3. Click on an existing script within the Python-Script category and press the Add new item Info toolbar icon to open the Edit script dialog.
4. Enter the name as "Python Script: PPD Discomfort > 20%", enable the program and copy and paste the script below into the script text area.
In summary, the script works as follows. After each simulation the SQL output file is opened and the building "Percentage Discomfort Area" EMS output is read for the RunPeriod. This floor-area-weighted % discomfort value indicates the % of time that the building was uncomfortable over the year. This value is converted to hours by dividing by 100 (converting a % to a fraction) and multiplying by 8760 (hours in the year). The value for the simulation is then written to the special "ParamResultsTmp" table together with the name of the Objective to be picked up by DesignBuilder when it processes the simulation results.
from db_eplusout_reader import Variable, get_results
from db_eplusout_reader.constants import *
from datetime import datetime
# ensure that SQLite outputs are generated
def before_energy_idf_generation():
site = api_environment.Site
for building in site.Buildings:
building.SetAttribute("SSSQLiteOP", "1")
def after_energy_simulation():
file = api_environment.EnergyPlusFolder + r"eplusout.sql"
variables = Variable("EMS", "Percentage Discomfort Area", "")
results = get_results(file, variables=variables, alike=True, frequency=RP)
discomfort_hrs = results.scalar
site = api_environment.Site
table = site.GetTable("ParamResultsTmp")
record = table.AddRecord()
record[0] = "PPD Discomfort > 20%"
record[1] = str(discomfort_hrs)
Tip: To save time you can copy the above script and paste it into the dialog.
Click on the Simulation tab and press update to re-run a base annual simulation with the Monthly and RunPeriod results option checked.
Important Note: Make sure to switch off Daily, Hourly and Sub-hourly results for this simulation to ensure that the upcoming optimisation simulations and results processing are kept as efficient as possible.
Navigate to the Optimisation + UA/SA tab on the Simulation screen and press the Update toolbar icon to open the Optimisation Calculation Options dialog. You can accept the default optimisation settings for the purposes of this tutorial.
Press the Start button to run the optimisation simulations.
After the optimisation has converged and you have closed the Calculation Options dialog, you should see results similar to those below on the main screen. Depending on the speed of your machine and the number or cores available, it will some time before all the simulations required for the optimisation are completed.
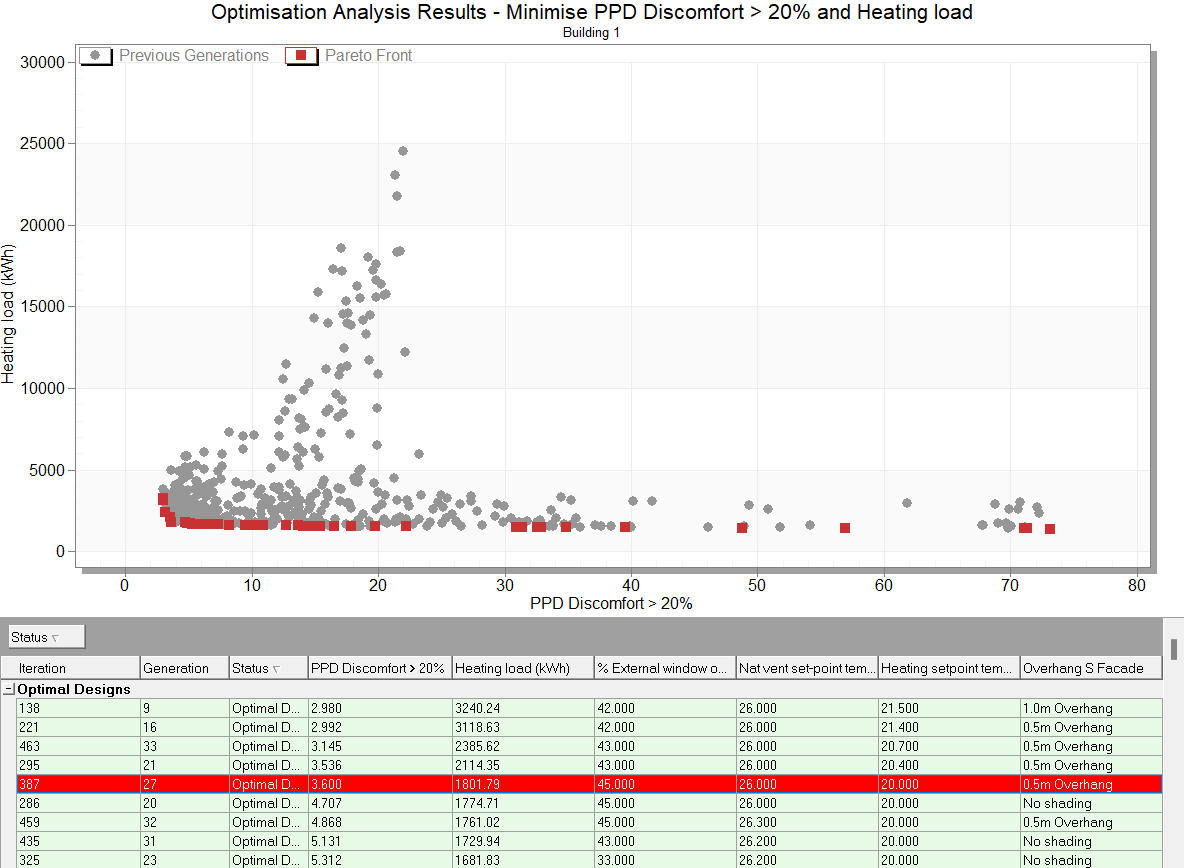
The results show that to minimise both heating energy and PPD discomfort over the year, the following optimal variable settings are indicated:
Heating setpoint temperature of 20°C.
Natural ventilation setpoint temperatures of around 26°C. Natural ventilation setpoints below this increase the chance of simultaneous heating and venting and hence increase heating load for no benefit in comfort, while higher setpoints do not provide sufficient venting to maintain comfortable conditions in the summer.
Window opening % of around 45%. Values below this do not give enough venting to keep occupants cool in summer, while higher values increase the incidence of simultaneous heating and venting.
Overhang lengths on the South facade of 0 to 1.0m are favoured.