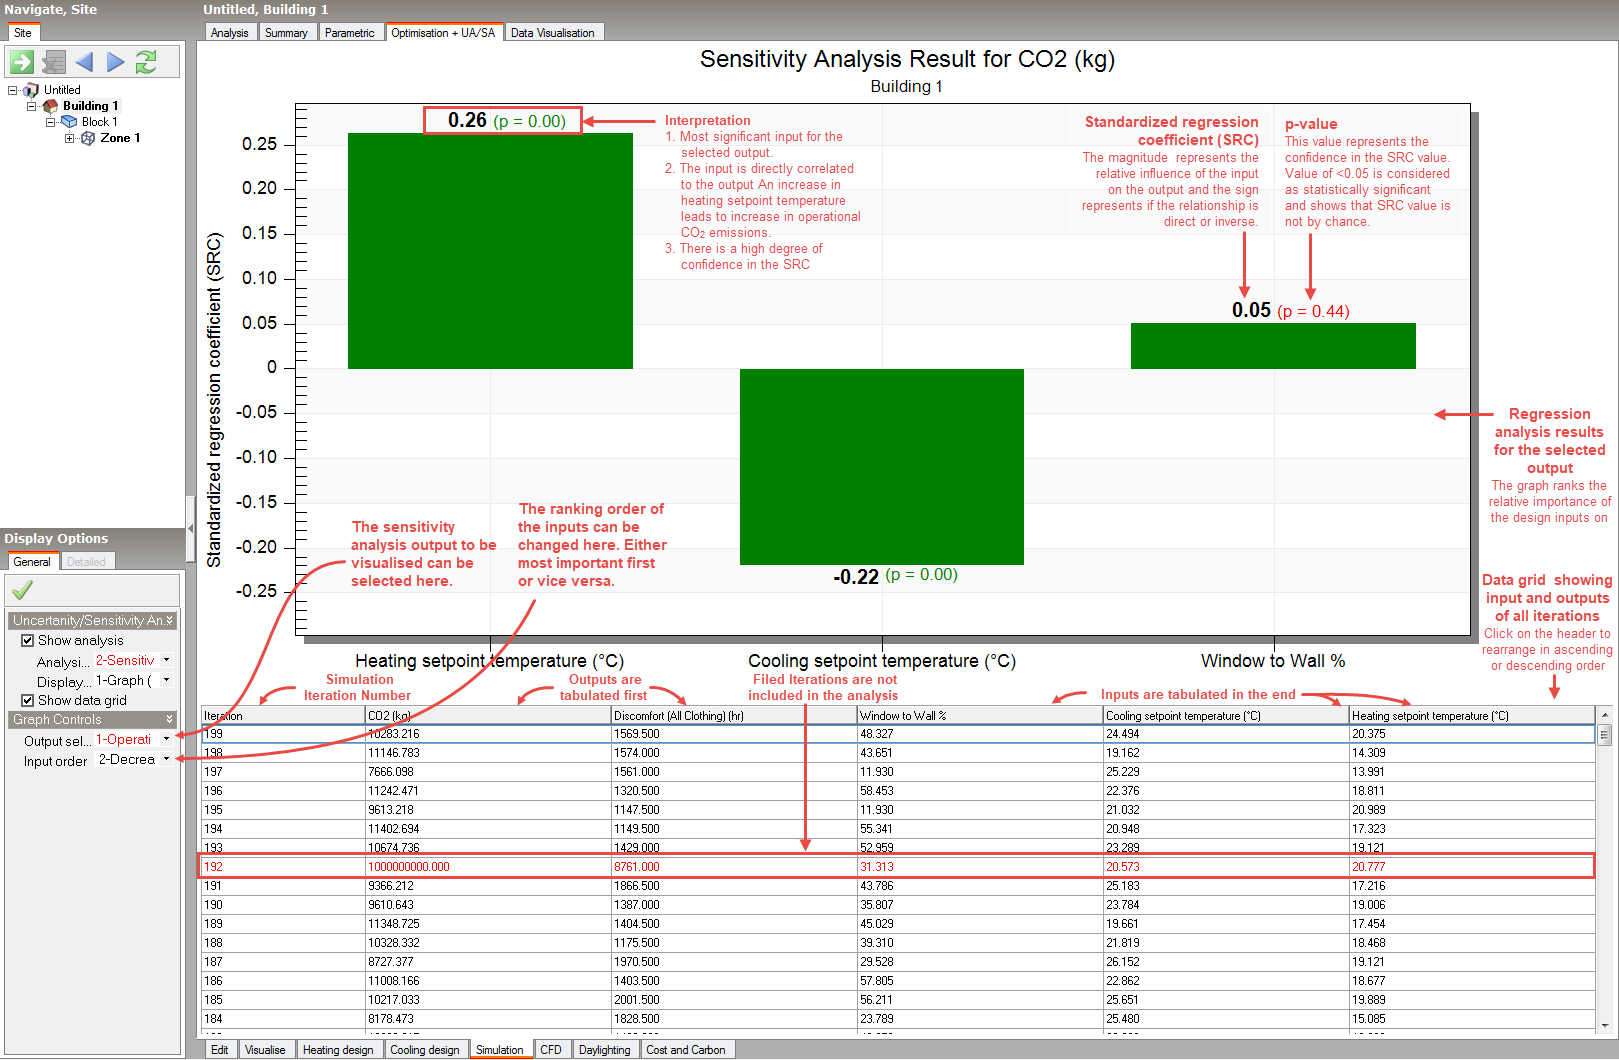
After finishing the uncertainty and sensitivity analysis, sensitivity analysis results can be accessed from the Simulation screen, by setting the Analysis type to 1-Sensitivity Analysis and Display type to 1-Graph (SRC). The screenshot below shows the main features of the sensitivity analysis results graph.
Graph plots one output at a time.
Option selected here determines which output is plotted in the graph. List contains all available outputs that were requested as a part of uncertainty analysis run.
This option helps in sorting the most sensitive outputs:
After finishing the uncertainty and sensitivity analysis, the Sensitivity Analysis Report can be accessed from the Simulation screen, by setting the Analysis type to 1-Sensitivity Analysis and the Display type to 6-Report. The report consists of following sections:
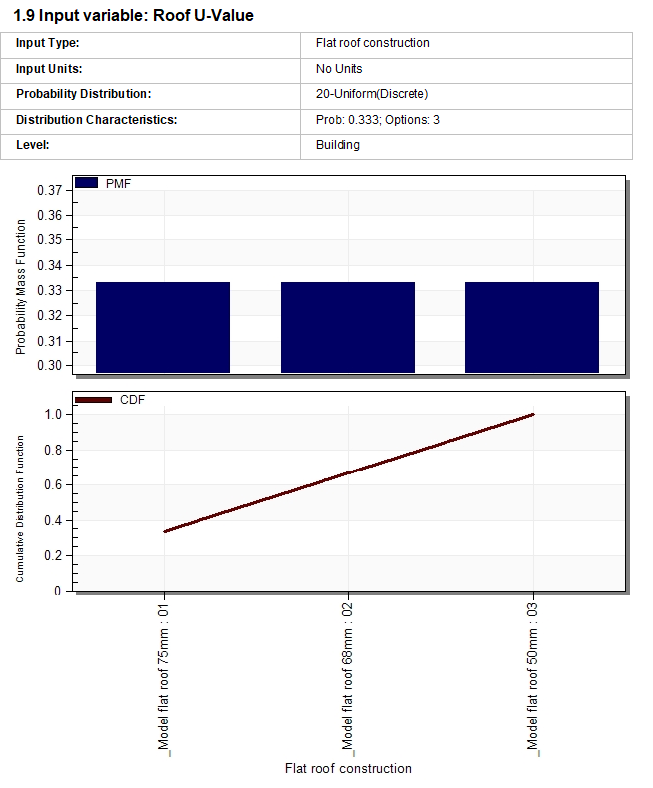
The report shows input details of all design variables with their distribution curves (below). These requested distribution curves were input to the UASA engine. The actual distribution curves for the analysis are shown below under Analysis Information. If there were enough simulations in the analysis then the 2 distribution profiles should roughly match.
Example Input Variable report for a discreet variable:
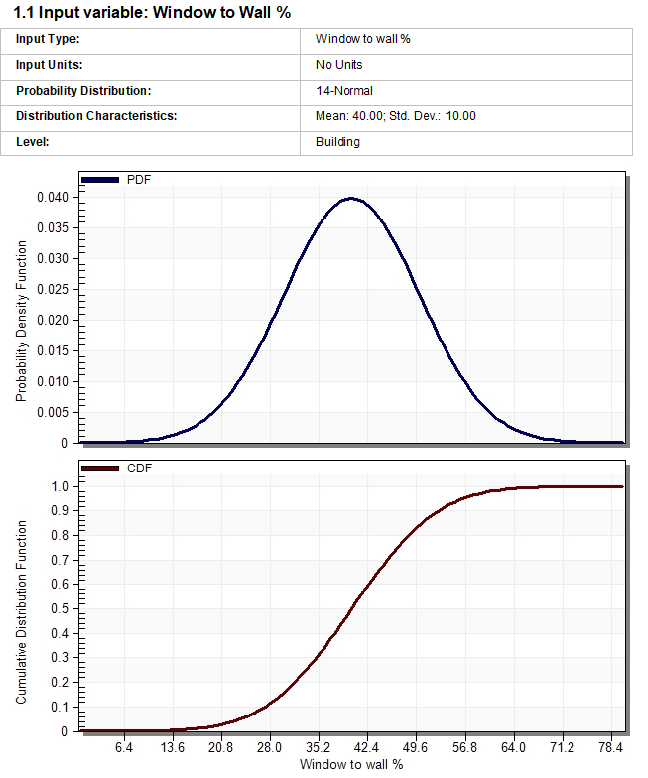
Example Input Variable report for a continuous variable requesting a normal distribution:
The next section lists of all of the outputs analysed. In the example below the analysis follows best practice in running a separate analysis for each KPI. This is why there so there is only one output listed.
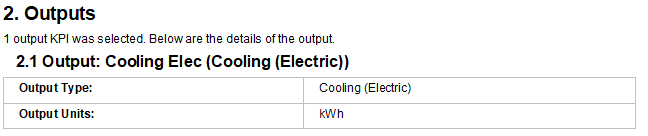
Then for each output the following sections are included.
The screenshots below shows examples of the input sample details section.
Example sampling details for a discreet variable:
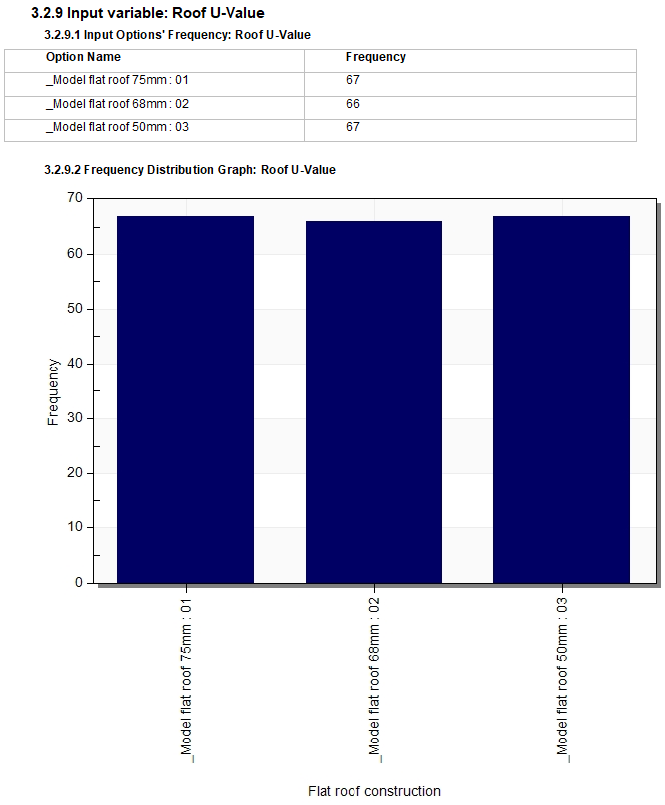
This is the simulated distribution frequency for the same "Roof U-value" variable as shown above under Input Variables. Note that the distribution is even as requested in the inputs.
Example sampling details for a continuous variable:
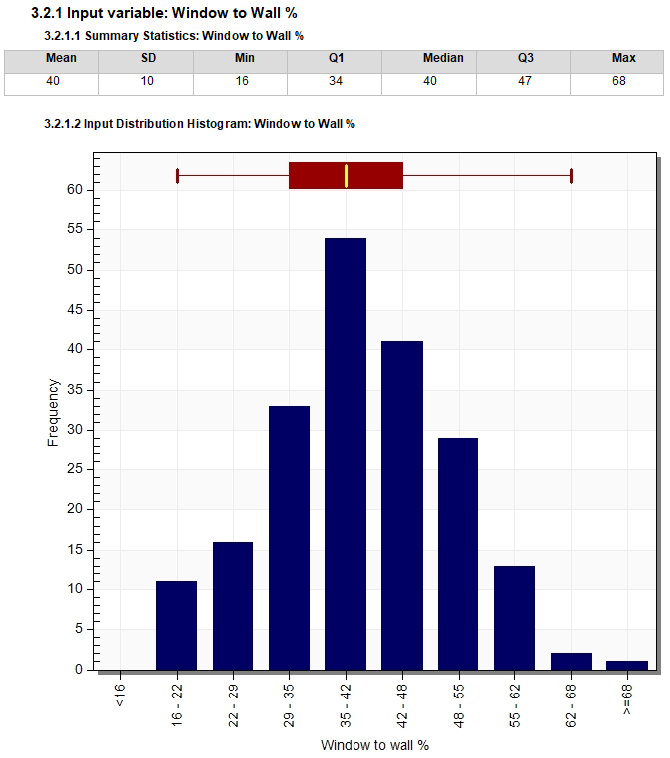
This is the simulated distribution frequency for the same "Window to Wall %" variable as shown above under Input Variables. Note that the distribution is close to "normal" as requested in the inputs.
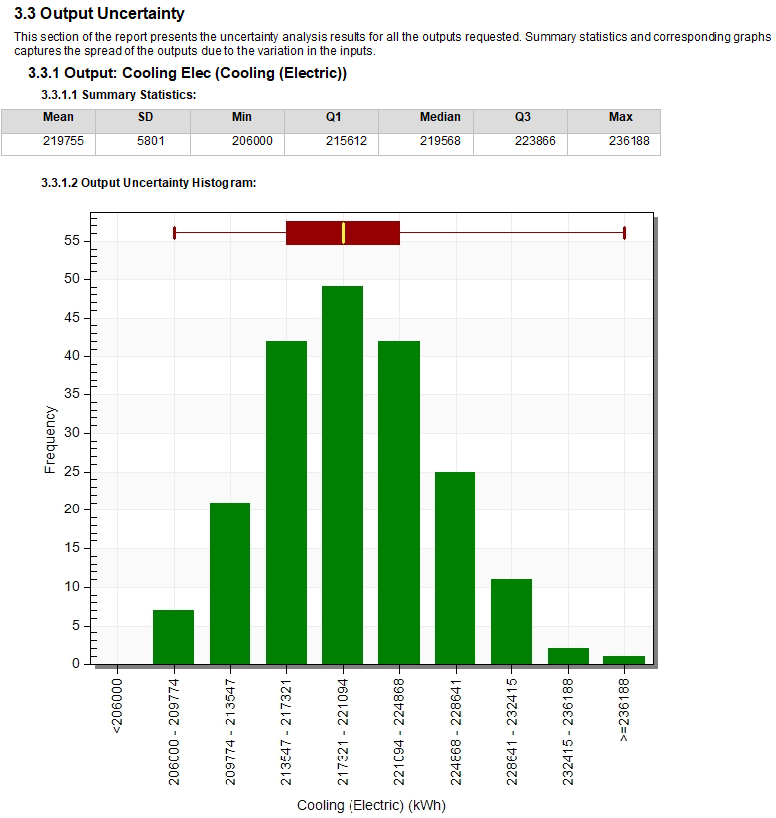
The Output Uncertainty section of the report presents the uncertainty analysis results for all the outputs requested. Summary statistics and corresponding graphs capture the spread of the outputs due to the variation in the inputs.
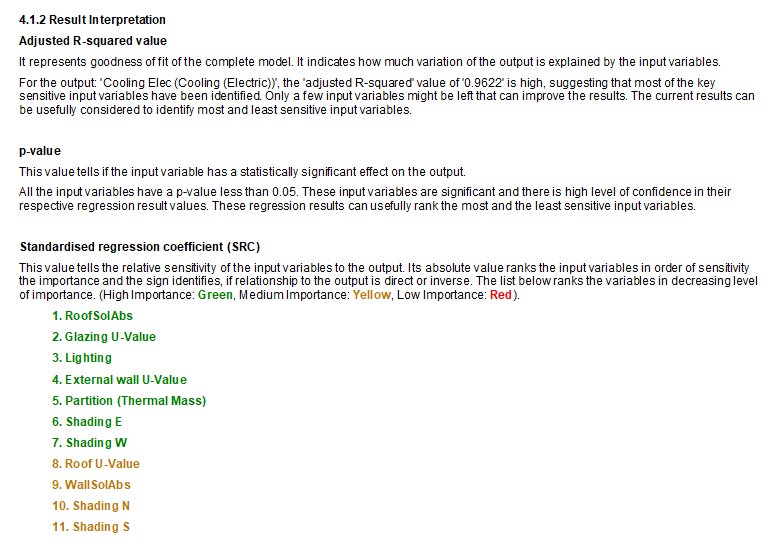
The SA results are provided in the form of a histogram showing the SRC for each of the variables which are ranked in order of significance. The magnitude of each SRC value signifies the relative influence of the input on the output and the sign represents whether it is a direct or inverse relationship.
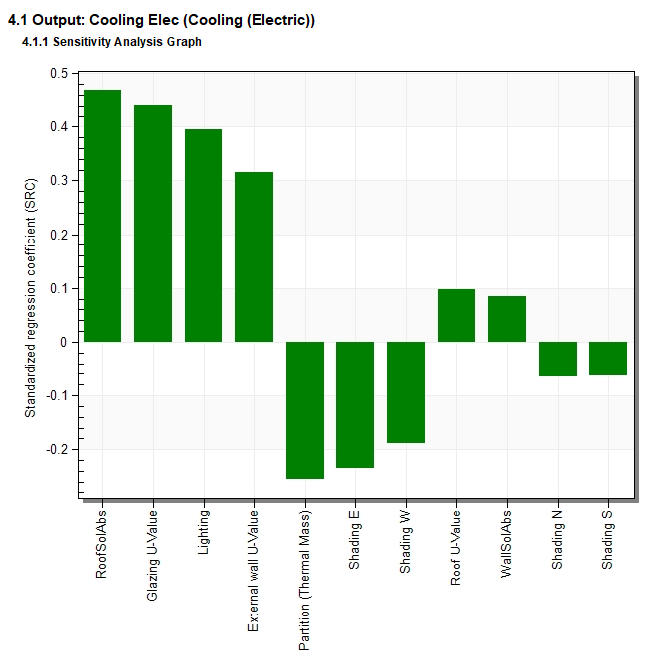
The histogram is followed by a section which provides an interpretation of the results in readable text. It summarises the main findings of the analysis, including which variable is most influential in determining the output and those which are less so. The variables are listed in order of significance and a colour code indicates the significance of each one. High importance variables are shown in green, medium importance in yellow and low importance in red.
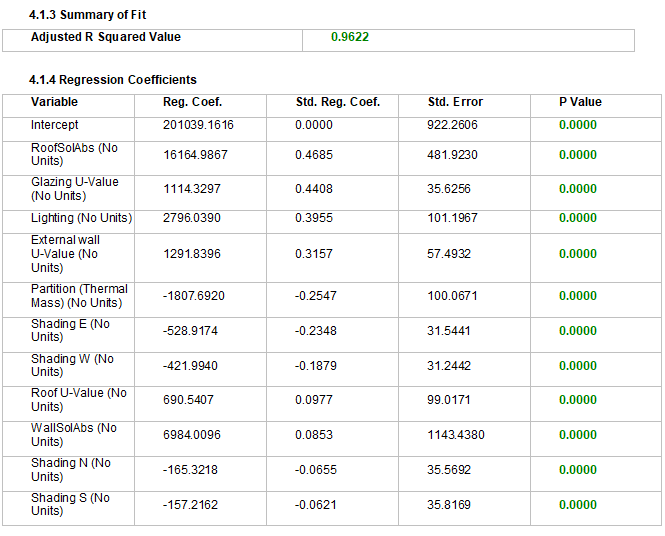
The overall Adjusted R Squared Value is also provided along with the variable regression coefficients, standard Errors and P-values.
Before analysing the Standardised Regression Coefficient (SRC) results it is important to first check the statistics to ensure that the regression based Sensitivity Analysis was successful and that the results are meaningful:
The overall Adjusted R-Squared value, if greater than 0.7 (ideally, greater than 0.9) indicates that the regression equation can explain the output with high precision. Adjusted R-Squared value less than 0.7 (ideally, lower than 0.4) indicate that the variables selected are bringing high uncertainty to the selected output and the regression cannot determine accurate results. In this case it may be necessary to check whether further variables need to be added to the study or existing variable ranges made more fine-tuned. Please note that low R-squared values are problematic only when you need high precision and in most cases medium to low R2 values can still be useful. In such models with weaker correlations you can still ascertain general trends for input variables are that are statistically significant (p-values < 0.05), and you can draw important conclusions about the relationships between those inputs including direct or inverse relations between inputs and the output.
The P-values indicates the confidence (statistical significance) in the SRC calculated for each variable and should ideally be lower than 0.05, in which case they are displayed in green on the sensitivity analysis graph. A low p-value is essential for confidence in SRC value of individual variables. However in some result sets there can be scenarios where, Adjusted R-Squared value is medium to high, p-values of all important ranking (high SRC) inputs are <0.05, but some of the low importance ranking (very low SRC) inputs have high p-values (>0.05). In those cases, result interpretation (importance order) can be accepted with reasonable confidence.
If the statistics indicate good confidence in the correlation it is safe to interpret the results as described above. Otherwise, if there are any issues with the SA results, some recommended actions to improve the accuracy are:
Check that any discrete variables have their selected options listed in order of impact (increasing or decreasing) on the output of interest.
Check for the dominance of one variable and remove them from analysis. They will still be the most important variable and the subsequent analysis would focus only on the second best. For example if one of the variables is the HVAC system type, and the KPI of interest is cooling energy consumption, then the type of HVAC system selected will typically have a significant impact and lead to domination of the results. In an optimisation study, the same set of variables might lead to clusters of results on the Pareto graph, one cluster for each HVAC system. If one variable dominates then it can help to fix the value for that setting and re-run the study without the dominant variable.
Remove variables of low importance to reduce unnecessary noise.
Increasing the number of simulations can improve the results, specifically improve the p-values.
Check the spread of variable values and their distribution. Sometimes they can be very narrow or wide, either because max and min ranges are incorrect or the distribution for sampling results leads to narrow or very wide ranges.