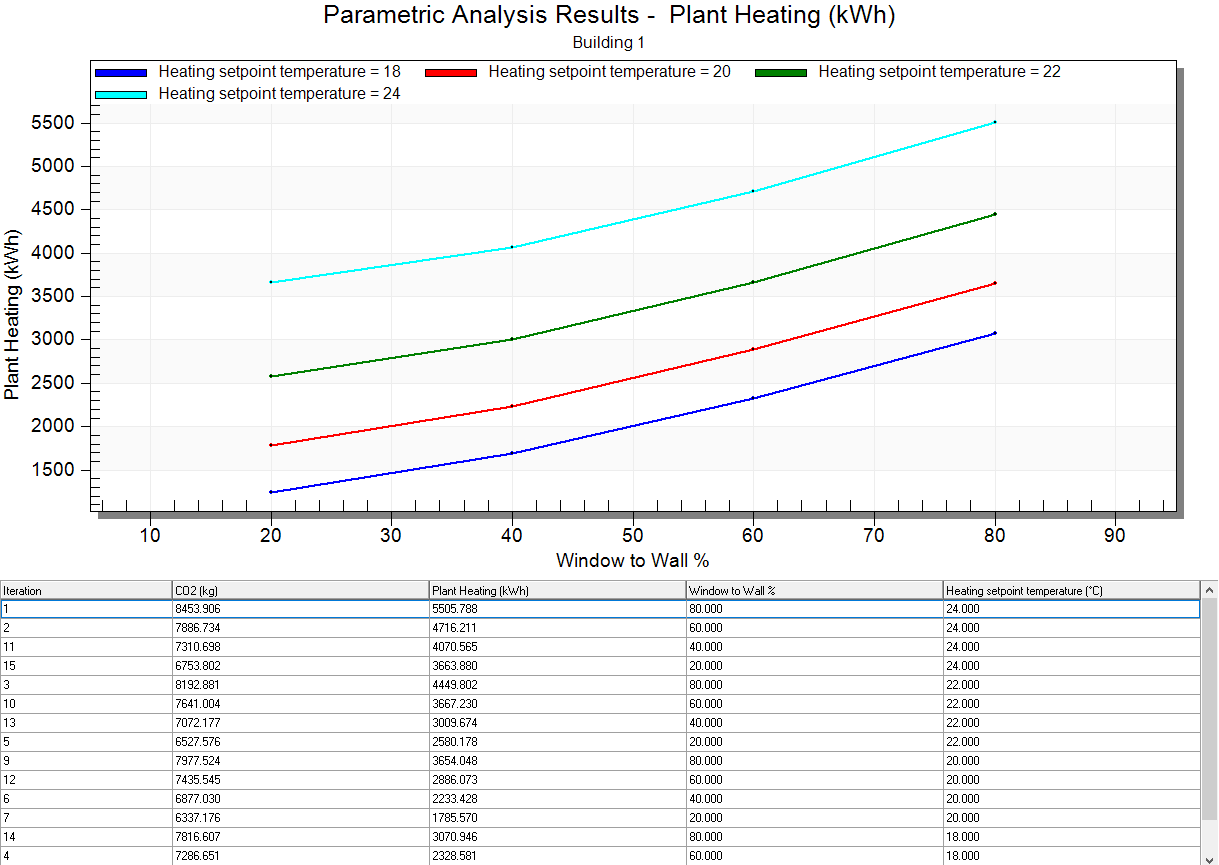
The Parametric analysis results allow you to view the outputs of the analysis in the form of both design curve graphics and a full listing of all results for each design iteration tested.
Once the parametric analysis simulations have completed and the Calculation Options dialog has been closed the results are loaded to the main screen for review. There are some simple settings to allow you control the results to be viewed as described below.
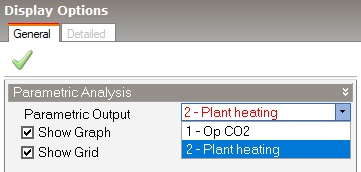
Select the output to be displayed in the graph on the right. The list of available outputs will match the list of output KPIs previously set up on the Outputs tab of the Parametric, Optimisation and UA/SA Analysis Settings dialog.
Check this checkbox to show the design curve graphic on the main screen to the right.
Check this checkbox to show the grid with all the results on the main screen to the right.
You can export the parametric analysis results by clicking on the Export  toolbar icon which opens the Export dialog.
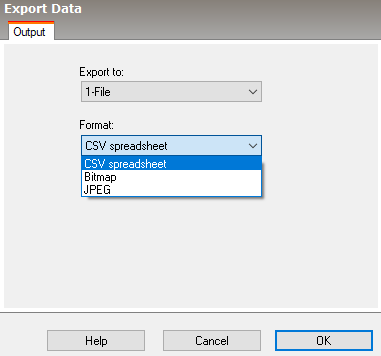
Here you can select whether to export the design curve graphic in Bitmap or JPEG form, or alternatively to export the underlying data itself as a csv file for further analysis in a spreadsheet.