This example shows how to run a parametric analysis with a custom KPI to evaluate the percentage area of discomfort in the building based on the CIBSE TM59 method. DesignBuilder doesn't include a built-in KPI for TM59 comfort, so this is added through a Python script.
A detailed set of instructions is provided to set up a 2-bedroom apartment model for TM59 parametric analysis. However if you prefer you can instead work with your own TM59 model and make appropriate adjustments to the tasks below. Of course in this case, your results will be different from the example results presented in Step 7.
1. Create a new model located at London Gatwick.
Note: For this example, default London Gatwick weather data is used, however, for TM59 analysis, the minimum requirement for TM59 simulations is to use DSY1 weather data for the nearest location and the 2020s, High emissions, 50th % percentile scenario. You can obtain CIBSE Future 2016 weather files suitable for use in TM59 analyses from the DesignBuilder CIBSE weather data webpage.
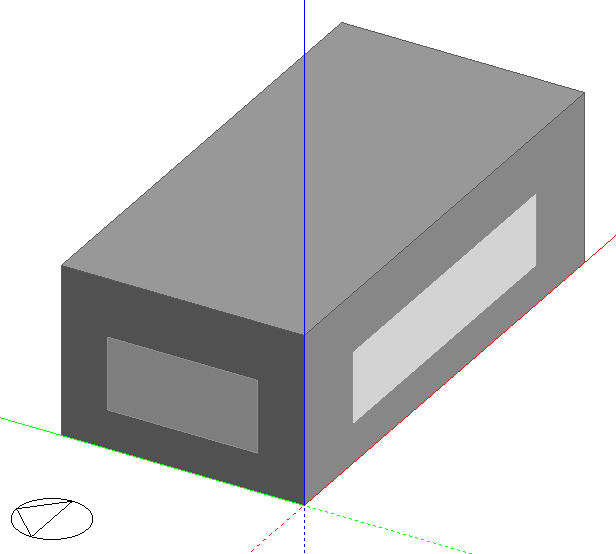
2. Add a building using default settings and draw a rectangular block measuring 10m x 5m. It should look like the image below.
3. Subdivide the block into 5 zones as follows: 2 single bedrooms, 1 living/kitchen and 1 corridor. The dimensions for each zone are provided in the image below. Enter appropriate names for each zone.
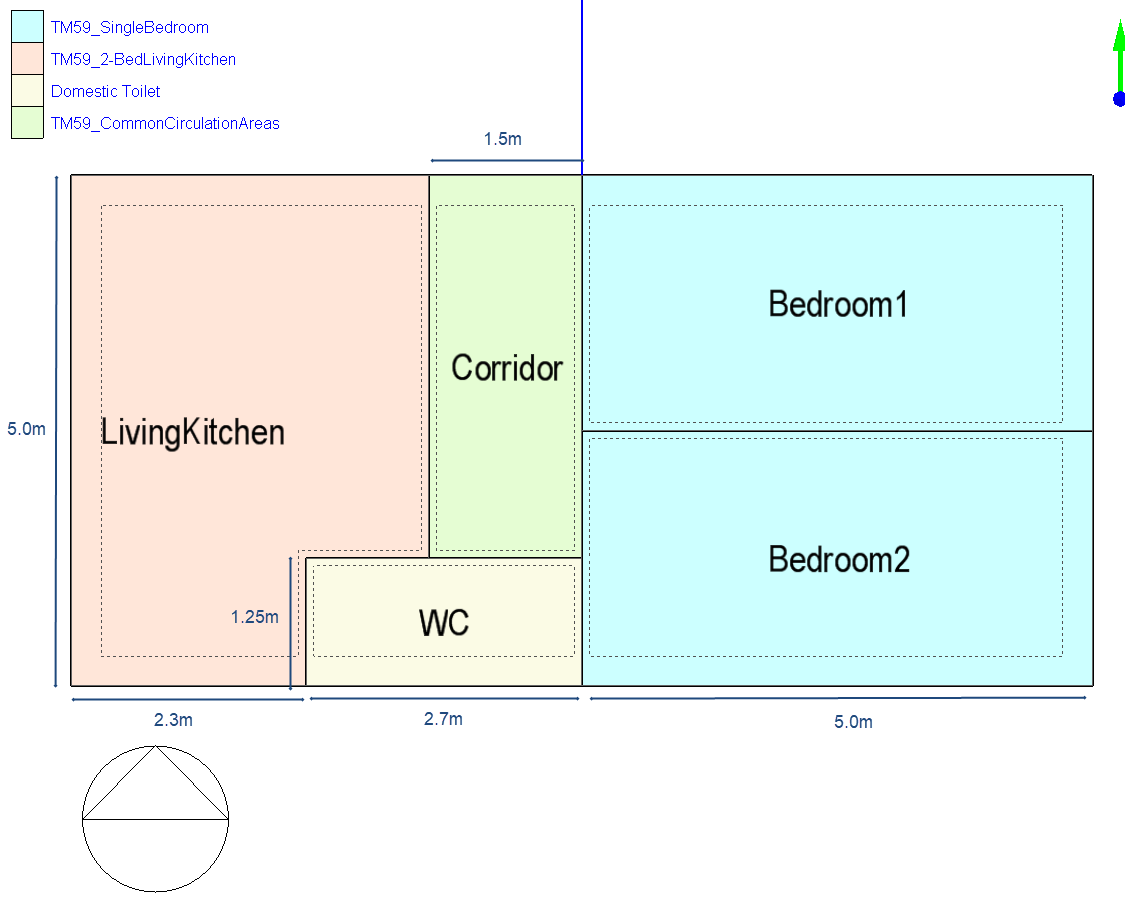
The image above also shows zone colours due to activity assignment , see point 9 below.
4. Define the external windows and doors. At building Level:
Delete the large south-facing window in Bedroom2.
Delete all north-facing windows.
Delete the south-facing window in the WC zone.
5. Navigate to the Living/Kitchen west-facing surface and:
On the Openings tab add a new External door by checking the Doors > External > Auto generate checkbox.
Set the Preferred width to 1.0m.
Set the Preferred height to 2.1m.
6. Navigate to the WC south-facing surface and add a 1m x 1m custom window. Note that because it is a custom window its size will not be affected by parametric changes to the Window to wall %.
7. Open the Model options dialog. The following Model option settings should be applied:
Gains data: Early
Gain definition level: 1- Globally in model options
Occupancy method: 3- Number of People
Occupancy latent gains: 2- Fixed Fraction
Equipment gain units: 2-Absolute Zone Power
Lighting gain units: 1-Power density
Natural ventilation: Calculated
On the Advanced tab, uncheck the Lump similar windows on the surface option.
On the Simulation tab set the Time steps per hour to 6. This change is not essential to follow the learning points in this tutorial but it is good practice for accurate Calculated natural ventilation simulations, especially when accurate overheating results are required.
8. Switch on TM59 Outputs:
Still on the Model options dialog, on the Simulation tab, under the Output, Graphable and Comfort and Environmental headers, check the CIBSE TM59 checkbox to ensure that DesignBuilder generates standard TM59 outputs. These standard outputs will need further processing to create a single discomfort value for the whole building and we'll write a Python script to do that in Step 3.
Still on the Simulation tab, under the Output and Miscellaneous Outputs headers, select the SQLite output option. This will ensure that EnergyPlus generates the results in a form that can be read by our TM59 script.
These settings are discussed in the TM59 Analysis Guide.
Press OK to close the Model options dialog.
9. On the Activity Tab, define the activities for each zone. You can find the TM59 activities under the Residential spaces category:
Bedrooms: TM59_SingleBedroom
LivingKitchen: TM59_2-BedLivingKitchen
Corridor: TM59_CommonCirculationAreas
WC: Domestic Toilet
10. On the HVAC tab at building level:
Select the Radiator heating, Boiler HW, Nat Vent HVAC Template. Note that the key changes that selecting this HVAC template has on the model for the purpose of this tutorial are:
Switches off Cooling
Switches on Natural Ventilation
Note : TM59 outputs will only be reported for zones without mechanical cooling.
11. On the Openings tab at building level:
Under the External Windows > Operation headers, change the Schedule definition to 2-Custom schedule
Change the Operation schedule to TM59_Unrestricted_Openings
Note: Approved Document O states that for buildings at ground level opening restrictions should be applied due to privacy and security. However, for this example, all openings are unrestricted.
Under the Doors > External > Operation header:
Set the % Time door is open to to 0.
Under the Doors > Internal > Operation header:
Set the Schedule definition to 2-Custom schedule.
Change the Operation Schedule to TM59_Unrestricted_Openings.
Set the % Area door opens and % Time door is open to 100 for internal doors.
Check Auto generate to create doors in all internal surfaces by default.
Set Preferred width to 0.9m and Preferred height to 2.0m.
Remove the internal door between the 2 bedrooms by navigating to the adjoining partition and unchecking the Auto generate checkbox.
Similarly, remove the internal door between the LivingKitchen and WC zones.
12. On the Lighting tab at building level:
Select the TM59_Lighting Lighting template
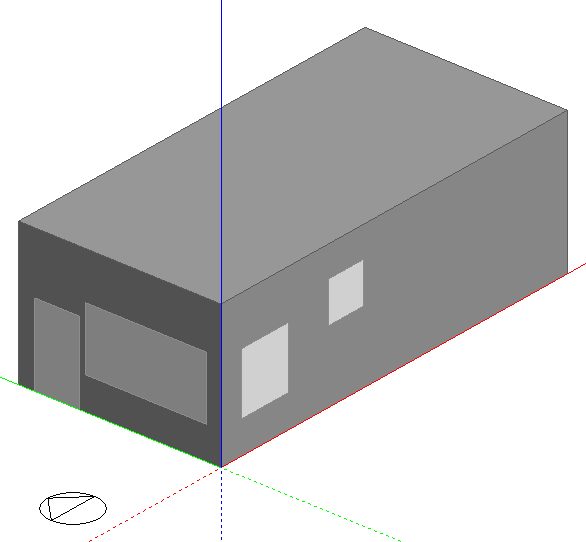
The model should now look like the image below.
Click on the Simulation tab and run a set of simulations to check the operation of the nat vent system to make sure you understand how it works in practice. You should generate hourly or sub-hourly results to gain the best understanding on model behaviour.
Are comfort conditions adequate during the summer? Is the air change rate excessive at any point? Do you see any simultaneous heating and venting? Make any adjustments to the model and repeat this step until you are satisfied with the base model hourly results.
In this step we will be setting up 2 design variables based on these standard variable types:
% External window opens
Window to wall %
1. Open the Parametric, Optimisation and UA/SA Analysis Settings dialog by clicking on the  toolbar icon.
2. On the Analysis Type tab, set the Analysis type to 1-Parametric Analysis
3. Go to the Design Variables tab and delete all default variables in the list. We will be adding the 2 new variables here.
Tip: The suggested order is to add % External window opens first, then Window to wall %. This ensures that % External window opens appears on the X-axis and there will be a set of curves, one for each Window to wall % option.
3.a. Add a new Variable and select the % External window opens Variable type. You can find it in the Natural Ventilation/Infiltration category.
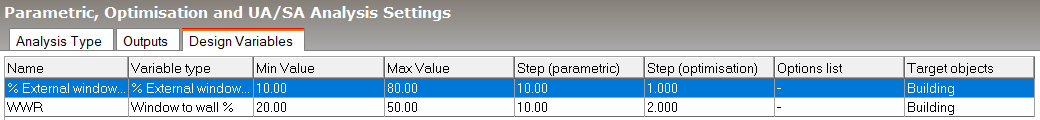
3.b. Change the Min value to 10 and the Max value to 80 to allow the window opening area to vary between 10 and 80%.
3.c Set the Step (Parametric) to 10.
3.d Keep the default Building target so that the % opening area varies similarly in all external windows and press OK to complete the definition of the % External window opens variable.
4.a Add a new Window to Wall % variable and edit Min value to 20 and Max value to 50 to allow the WWR to vary between 20 and 50% for all wall surfaces with windows.
4.b Set the Step (Parametric) to 10.
4.c. Keep the default target of Building and press OK to complete the definition of the Window to Wall % variable.
After Step 3 is complete the Design Variables tab should look like this:
You won't be able to save the settings and close the Analysis Settings dialog until the parametric analysis Output has been set up which brings us to the next task.
Click on the Outputs tab. The list of outputs will be empty if you started from a new model.
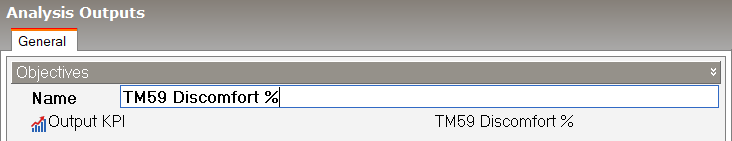
1. Add a new output and on the Analysis Outputs dialog browse the list of available Output KPIs.
2. DesignBuilder does not include a TM59 output so we need to create it. To create the TM59 comfort output, a new Summary Output (aka KPI) must first be created. Click on the Output KPI to open the list of existing Summary Outputs in the Info panel. Our new custom KPI won't be listed there at first, so create it now by clicking on the existing Custom Script Summary Output on the list of KPIs, click on the Create copy of highlighted item Info toolbar icon and edit the copy.
3. Make the following settings on the Summary Output dialog.
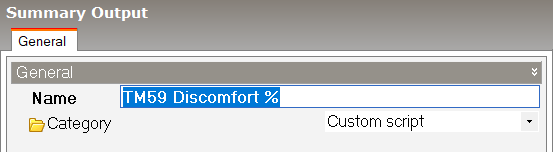
Note: The "TM59 Discomfort %" name entered here on the Summary Outputs dialog must match the name given in the custom KPI script described below. You may like to copy the name and paste it somewhere safe where you can easily access it later when writing the script.
4. Save the newly created KPI, select it on the Output Variables tab and press OK to return to the main Analysis Settings dialog.
You can new press OK on the Analysis Settings to dialog to confirm the parametric analysis settings.
The next task is to write the script that will read the base TM59 simulation outputs from the EnergyPlus output file, process them and pass back to DesignBuilder as a Custom KPI. The steps are as follows.
1. Click on the Scripts  toolbar icon to open the Script Manager dialog and click on the Enable scripts checkbox.
2. Click on the Script browse item. A list of the existing scripts appears in the Info panel to the right.
3. Click on the Python-Script category and press the Add new item Info toolbar icon to open the Edit script dialog.
4. Check the Enable program option.
5. Name the script "TM59 Discomfort".
6. Copy and paste the script below into the script window.
The script reads the TM59 Criteria 1, 2, and 3 outputs and checks against the corresponding criteria based on TM59 rules. Any zone passing the overall annual TM59 criteria has its area excluded from the total area failing. The TM59 Discomfort % value for the simulation is then added to the special "ParamResultsTmp" table together with the name of the Objective to be picked up by DesignBuilder when it processes the simulation results.
The "TM59 Discomfort %" Summary output is added as a record to the "ParamResultsTmp" table. More custom KPIs could be added to the table in a more sophisticated analysis.
"""
Use CIBSE TM59 results as optimisation KPI.
Required model inputs:
- Enable TM59 outputs
- Add a "Custom Script" KPI, use "TM59 Discomfort %" name
- Run a "Standard" simulation to make sure that TM59 outputs are present
The script calculates a percentage of failing TM59 relevant zones.
"""
import ctypes
import os
from db_eplusout_reader import Variable, get_results
from db_eplusout_reader.constants import *
from db_eplusout_reader.exceptions import NoResults
THRESHOLD_A = 3
THRESHOLD_B = 32
def show_message(title, text):
ctypes.windll.user32.MessageBoxW(0, text, title, 0)
def zone_fails_tm59(zone_name):
"""Verify if given zone meets tm59 criteria."""
outputs_path = os.path.join(api_environment.EnergyPlusFolder, "eplusout.sql")
variable1 = Variable("EMS", "CIBSE TM59 Criterion A {}".format(zone_name), "%")
variable2 = Variable("EMS", "CIBSE TM59 Criterion B {}".format(zone_name), "H")
criterion_a_results = get_results(outputs_path, variable1, RP)
criterion_a = criterion_a_results.scalar
fail = criterion_a > THRESHOLD_A
try:
criterion_b_results = get_results(outputs_path, variable2, RP)
criterion_b = criterion_b_results.scalar
fail = fail or criterion_b > THRESHOLD_B
except NoResults:
pass
return fail
def after_energy_simulation():
site = api_environment.Site
fail_area = 0
total_area = 0 # area only includes TM59 zones
for block in active_building.BuildingBlocks:
for zone in block.Zones:
zone_name = zone.GetAttribute("SSEPObjectNameInOP")
try:
if zone_fails_tm59(zone_name):
fail_area += zone.FloorArea
total_area += zone.FloorArea
except NoResults:
pass
try:
percentage_area_fail = (fail_area / total_area) * 100
except ZeroDivisionError:
raise NoResults("No TM59 results found!")
# show_message("Results TM59", "{}% fails, total_area {}m2, fail_area: {}m2".format(percentage_area_fail, total_area, fail_area))
table = site.GetTable("ParamResultsTmp")
record = table.AddRecord()
record[0] = "TM59 Discomfort %"
record[1] = str(percentage_area_fail)
Note: The script above is shown with the show_message line commented out, but the message can be enabled by removing the "#" character to display TM59 compliance results. Once you are confident that the TM59 script is working well you can delete or comment out the show_message line to avoid seeing messages after each simulation during the optimisation.
Tip: The DesignBuilderSoftware \ db-scripts Github repository includes the latest versions of the above script as well a variation where Criterion A and Criterion B are reported separately to give a more in-depth analysis of the results.
Click on the Simulation tab and press update to re-run a base annual simulation with the Monthly and RunPeriod results option checked.
Important Note: Make sure to switch off Daily, Hourly and Sub-hourly results for this simulation to ensure that the upcoming optimisation simulations and results processing are done efficiently.
Navigate to the Parametric tab on the Simulation screen, ensure you are at building level and press the Update toolbar icon to open the Optimisation Calculation Options and press the Start button to run the parametric simulation.
After the simulation has completed, you should see similar results to those below on the main screen:
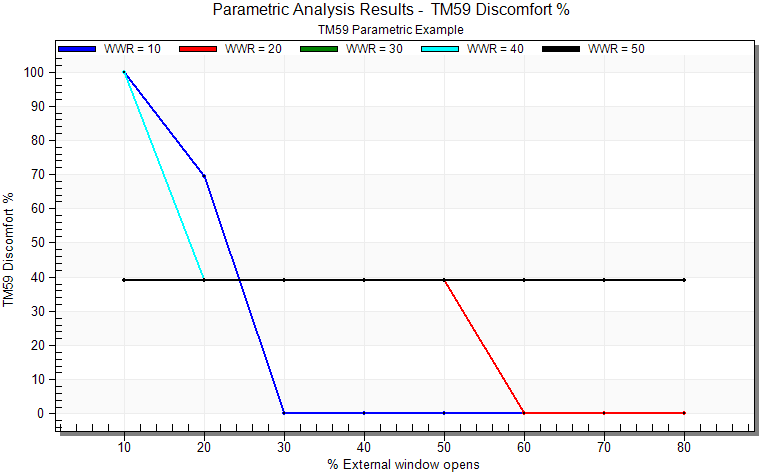
Some points to note are:
The parametric results show that the % External window opens variable has a significant impact on the TM59 Discomfort % with larger opening areas being needed to avoid discomfort due to overheating.
The parametric analysis TM59 Discomfort % graph only includes a limited number of result values (0, 38.9, 69.5 and 100) as there are only 4 permutations of pass/fail zones in this small model.
The results suggest that 20% WWR with 60% window opening area could be a viable solution. However if more glazing or smaller opening area is required then some window shading solution (e.g. overhangs or solar control glazing) may be required to ensure that the building meets the TM59 overheating requirements.