Building performance simulation is a highly complex process. Some or all of the model inputs are often best available estimates and simplifications that do not necessarily represent reality completely. These uncertainties in input variables can be due to:
This uncertainty in the inputs imposes a limit on our confidence in the output of the model, i.e. results of the simulation model are potentially erroneous. Such errors are quantified in uncertainty analysis which treats the simulation output as "probabilistic" rather than "deterministic".
A related field to uncertainty analysis is sensitivity analysis. While, uncertainty analysis is a method to quantify the variability of a model output due to uncertainty in the one or more input variables, sensitivity analysis is the study of how the uncertainty in each simulation output can be apportioned to various sources of uncertainty in its inputs.
Good modelling practice requires the modeller to evaluate their confidence in the model. This requires, first uncertainty analysis, a quantification of the uncertainty in any model results; and second sensitivity analysis, an evaluation of how much each input is contributing to the output uncertainty. Sensitivity analysis orders by importance, the strength and relevance of the inputs in determining the variation in the output.
The process of recalculating outcomes under alternative model input assumptions to determine the impact of a variable under sensitivity analysis can be useful for a range of purposes including:
Step 1: Quantify the uncertainty in each input (e.g. ranges, probability distributions). Note that doing this rigorously this can be difficult, and many methods exist to elicit uncertainty distributions from subjective data.
Step 2: Identify the model output to be analysed (the target of interest should ideally have a direct relation to the problem tackled by the model).
Step 3: Run the model several times using appropriate sampling methods and input uncertainties.
Step 4: Using the resulting model outputs to calculate the sensitivity measures of interest.
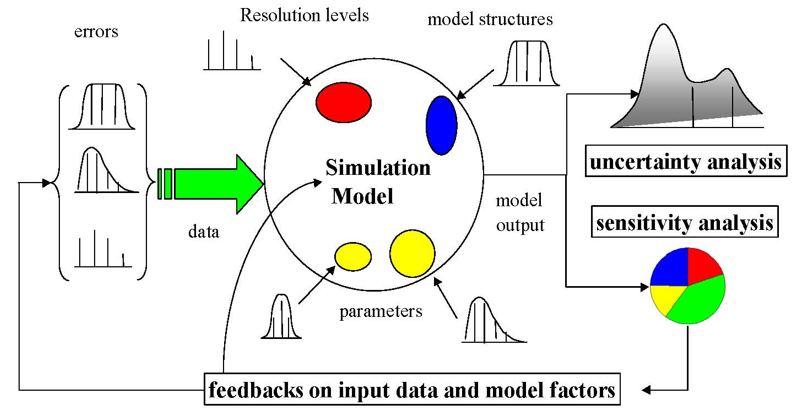
The figure below shows an ideal scheme of a sampling-based sensitivity analysis. Uncertainty arising from various sources – errors in the data, parameter estimation procedure, alternative model structures – are propagated through the model for uncertainty analysis and their relative importance is quantified via sensitivity analysis.
In DesignBuilder Uncertainty and Sensitivity Analysis, various sampling methods and a broad range of probabilistic distributions are supported for the input parameters. Statistics are performed on the simulation results of the sampled inputs to give uncertainty estimations. The Sensitivity Analysis method implemented in DesignBuilder is regression analysis. In DesignBuilder, any number of design variables can be included in the analysis for each of the selected outputs. While we can do uncertainty and sensitivity analysis using multiple inputs and multiple outputs, each output analysis is, in fact, an independent analysis.
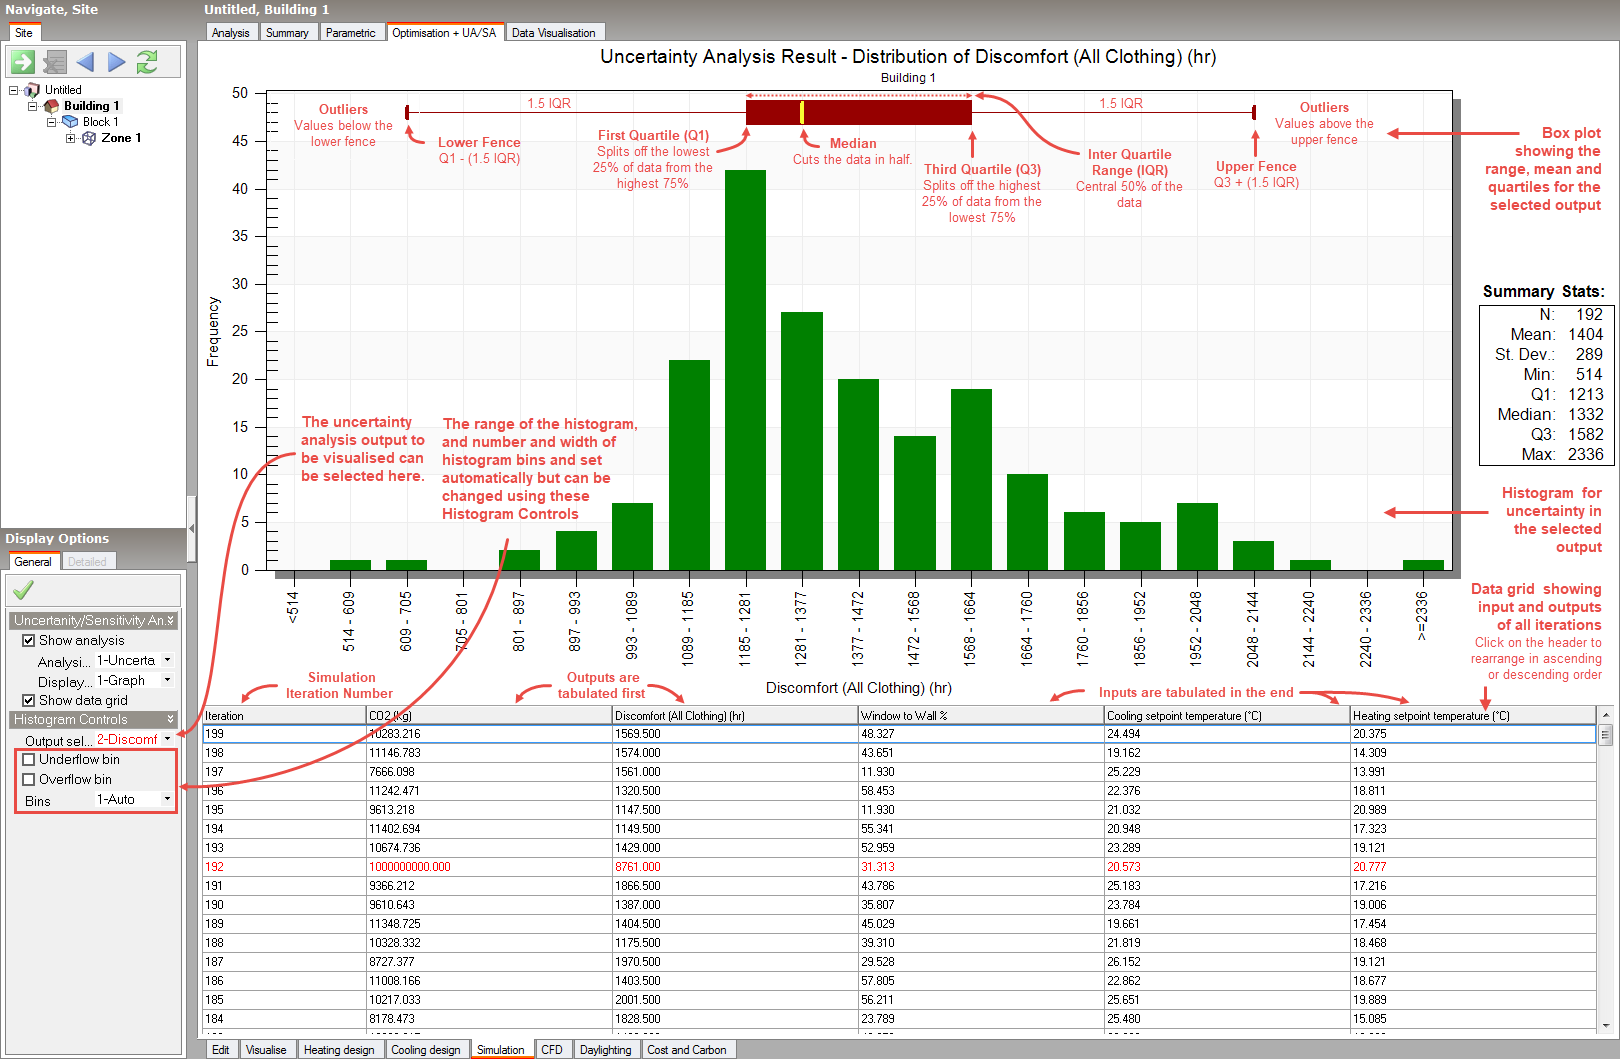
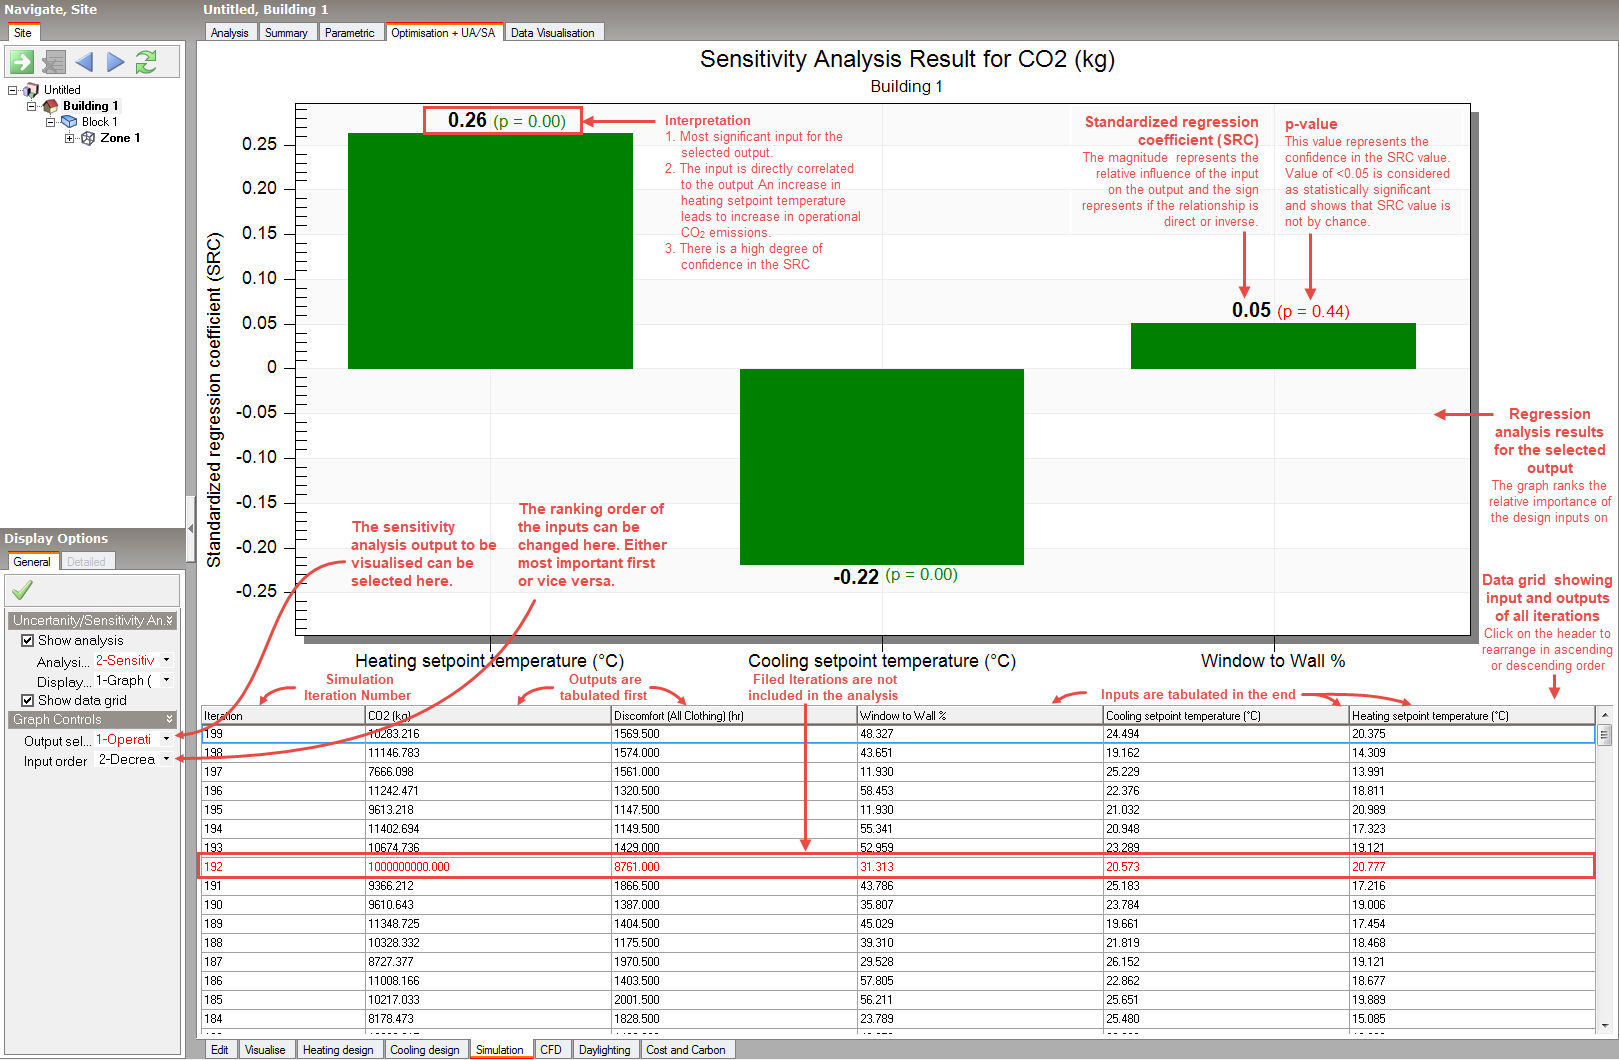
For example, an uncertainty and sensitivity analysis study for total building carbon emissions might involve a base design which is analysed for varying wall and roof construction, glazing amount and type, degrees of shading and HVAC systems. The uncertainty analysis results might be displayed graphically in the form of a histogram showing the variation in total carbon emission. The sensitivity analysis results for the output (total carbon emission) can be represented graphically in the form of a bar chat, in which each bar represents each input variable. The magnitude of the bar tells the relative importance of each variable. The longest bar represents the most important/sensitive input for the selected output. The sign of the bar tells us whether the relationship between the input and the output is direct or indirect. A positive value means that increase in the value of that input variable leads to an increase in the output result and vice-versa.
Tip: A good starting point to learn more about Uncertainty and Sensitivity Analysis is to follow through the Uncertainty and Sensitivity Analysis Basic and Advanced Tutorials.
Example Uncertainty Analysis Result:
Example Sensitivity Analysis Result:
To get started with an Uncertainty and Sensitivity Analysis go to the Simulation screen and click on the Optimisation + UA/SA Analysis tab. From the Simulation Optimisation + UA/SA screen, you can:
See also Wiki pages: