This topic covers the Daylighting display options specific to the 1-General Simulation type.
Select the reports you would like to display. Options for the 1-General Simulation type are:
1-Point in time - show illuminance and daylight factor results.
2-Annual - show annual sDA, ASE, UDI results.
When the 1-Point in time Option setting is made, the following report types are available:
When the 2-Annual Option setting is made, the following report types are available:
If a non-zero margin was specified in the calculation options, you can choose whether or not to include data points within the margin in the selected reports. If the margin calculation option was set to zero you can ignore these options.
The margin display options depends on the Report type setting.
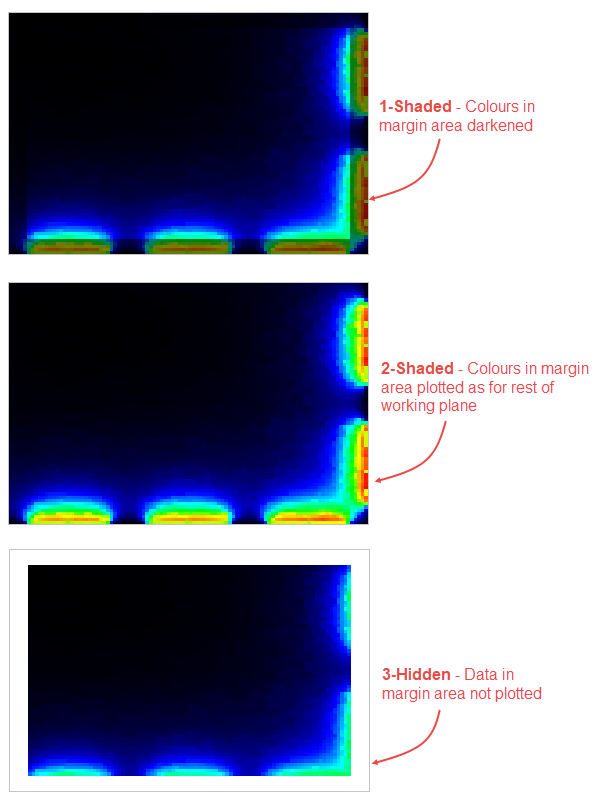
When the Report type is set to one of the map options, you can choose how the margin region at the edges of the working plane is displayed on the map. Choose from the options below.
1-Shaded - results in the margin are plotted, but the colours are darkened.
2-Not shaded - results in the margin are plotted the same as for the main area of the working plane.
3-Hidden - no results are plotted in the margin region which is displayed in white.
When the 1-Point in time Option setting is made and the Report type is set to 2-Grid, you can choose whether or not to include data points within that margin for the average and or min/max daylight factor calculations in summary reports and grids.
Check this option to include all areas in the average daylight factor summary results. Uncheck it to exclude data points in the margin.
Check this option to include all areas in the min/max daylight factor summary results. Uncheck it to exclude data points in the margin.
When viewing annual results and the 2-Grid Report type is set, the annual daylighting metric pass thresholds should be checked and, if necessary, changed.
Note: The annual daylighting thresholds are used to define acceptability and are split into two parts:
a. the illuminance thresholds which define the acceptable level of lighting at any one point in time over the year, and are defined on the Calculation options dialog, and,
b. metric pass thresholds, which are defined here the Display options panel, as described below.
Changing any of the Metric pass threshold settings in the Display options will typically change the Area in Range values shown on the grid.
Enter the % of the occupied year pass threshold used for each cell in the sDA calculations. sDA is usually defined as sDA 300,50%, which means that a given grid cell must achieve at least 300 lux (sDA lower illuminance threshold) for at least 50% (sDA Percentage annual hours) of the occupied year for its area to be considered to "pass" the criteria. The overall sDA metric for a zone is the % of the floor area that passes in this way.
Enter the number of occupied hours in the year pass threshold used for each cell in the ASE calculations. ASE 1000,250 means for a given cell the illuminance must not be greater than the 1000 lux threshold (ASE illuminance threshold) for more than 250 hours (ASE annual hours) in the (occupied) year to pass.
Enter the % of the occupied year pass threshold used for each cell in the UDI calculations. A pass threshold value of 50% means that a given cell must achieve an illuminance of between 100 and 3000 lux (or whatever values were specified as the lux bounds in Calculation options) for at least 50% of the occupied hours in the year.
When viewing point in time results and the 2-Grid Report type is set, the illuminance daylighting pass thresholds should be checked and, if necessary, changed.
Select from:
1-Daylight factor, set the min average daylight factor threshold.
2-Illuminance, set the min and max illuminance threshold values.
When the Threshold type is set to 1-Daylight factor, set the minimum average daylight factor to be used in calculating the Floor Area Within Limits grid outputs.
When the Threshold type is set to 2-Illuminance, set the minimum illuminance to be used in calculating the Floor Area Within Limits grid outputs.
When the Threshold type is set to 2-Illuminance, set the maximum illuminance to be used in calculating the Floor Area Within Limits grid outputs.
The Scale settings are available when the Report type is set to one of the map options:
The scale of the daylight maps can be defined using data from the building, block or zone level or it can be entered manually. It is a way to define the minimum and maximum values on the scale. Select from one of the following options.
When the 1-Point in time Option setting is made, Value source defines whether to view Daylight factor or Illuminance results. Select from:
1-Daylight factor - daylight distribution maps are plotted as daylight factors.
2-Illuminance - daylight distribution maps are displayed based on illuminance data.
When the 2-Annual Option setting is made, Value source defines whether to view results as Annual hours or Percentage annual hours. Select from:
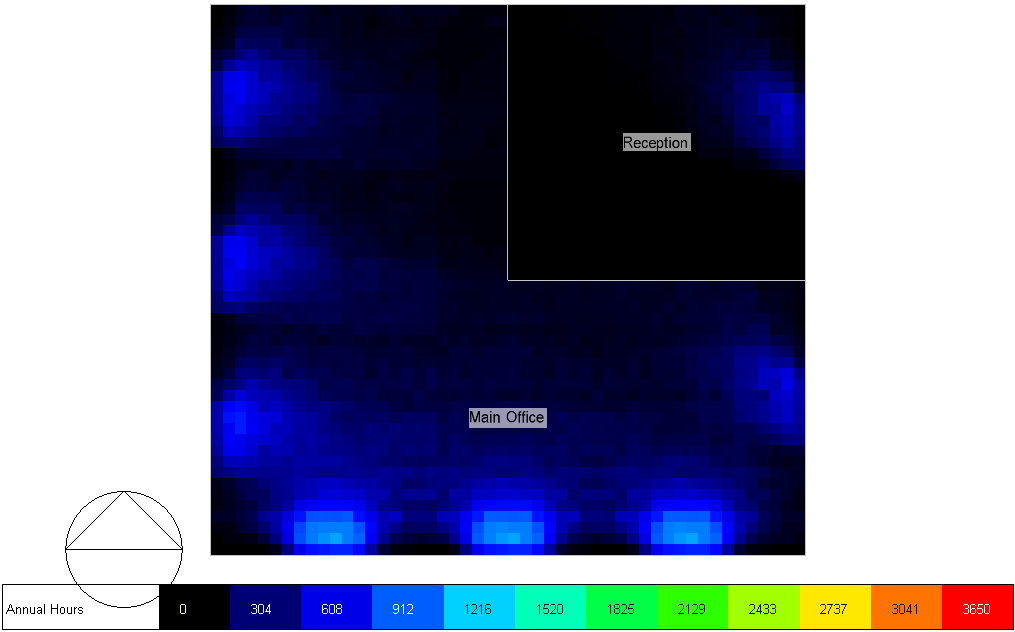
1-Annual hours - daylight distribution maps are plotted as the number of annual hours for which the selected criteria are met.
2-Percentage annual hours - daylight distribution maps are plotted as the % of annual hours for which the selected criteria are met. The denominator used in the % calculation is the total number of occupied hours.
Note: when Source is set to 4-User defined, Value source is hard set to 1-Annual hours.
When using the 4-User defined Scale source you can enter the minimum scale value to be displayed. The units and meaning of this setting depend on the Value source setting, i.e. the data that is being plotted.
When using the 4-User defined Scale source you can enter the maximum scale value to be displayed. The units and meaning of this setting depend on the Value source setting, i.e. the data that is being plotted.
If you wish to set a specific colour to represent the areas of the working plane that have values below the entered Low value criterion then check this box and define the colour in the colour selector below.
Select the colour to be used to represent areas of the working plane that are below the entered Low value. Typically a dark grey or black colour might be used to show areas of the working plane that are inadequately daylit.
If you wish to set a specific colour to represent areas of the working plane that are above the entered High value then check this box and define the colour in the colour selector below.
Select the colour to be used to represent areas of the working plane that are above the entered High value.
This section explains the results generated when the 1-Point in time Option setting is made.
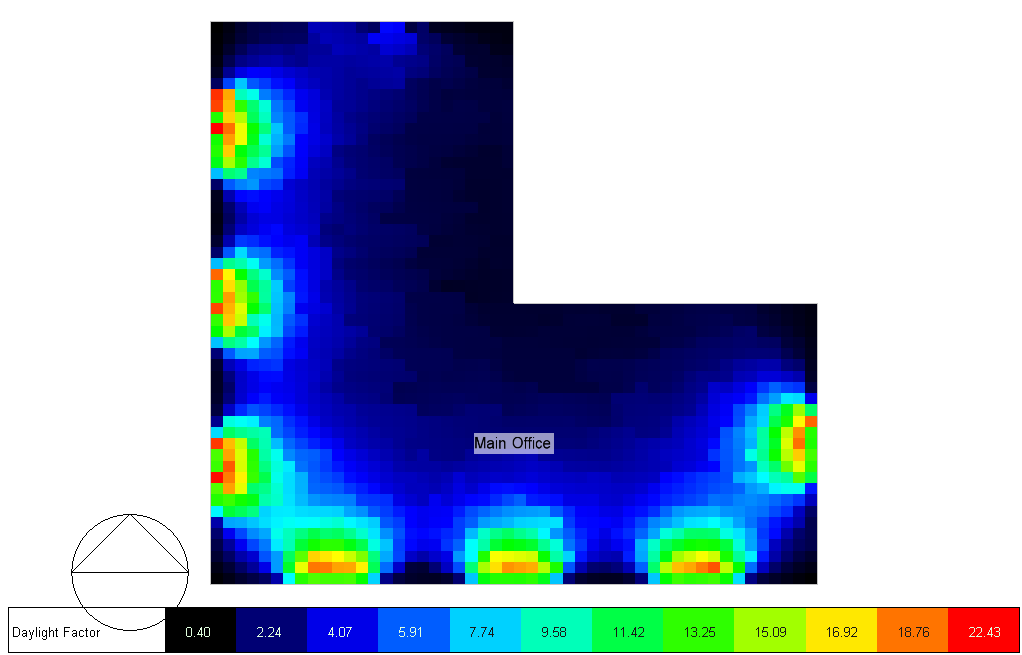
When the Report type Display option is set to 1-Map a contour map showing the distribution of the selected output across the working plane of the object is displayed. An example daylight map for a single zone is shown below.
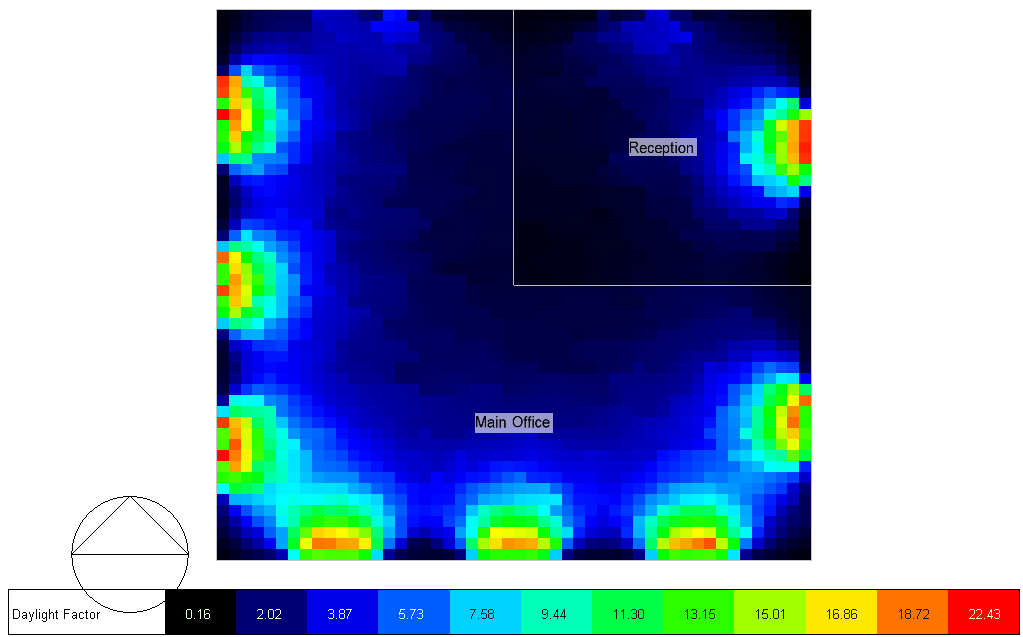
When at building and block levels maps of daylight distribution across the working plane of the current object can be displayed. An example daylight distribution map displayed across multiple zones is shown below.
When the Report type Display option is set to 2-Grid, a grid displays information on average daylight factors, daylight uniformity and illuminance values for each zone together with a total for the building. The following data is calculated for each zone:
This option can be especially useful if the built-in daylight reports don't cover the particular calculation you need to make. In this case you can export the summary data for each zone for further analysis in a spreadsheet.
An example grid output is shown below.

This section explains the results generated when the 2-Annual Option setting is made.
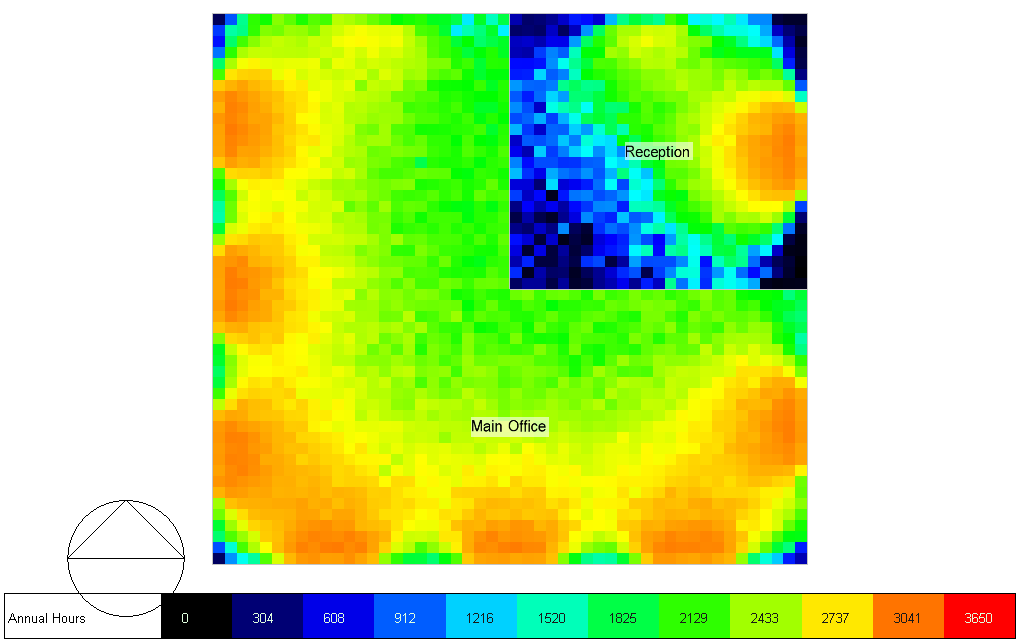
When the 1-sDA Map Option is selected, the distribution of sDA across the working plane for the current object is displayed. The main metric, sDA 300/50%, used in LEED v4 Option 1 daylighting calculations represents the percentage of the floor area that exceeds 300 lux for at least 50% of the occupied time. Unoccupied periods are ignored.
The minimum working plane illuminance threshold is set under the Metric pass thresholds header in the Display options panel.
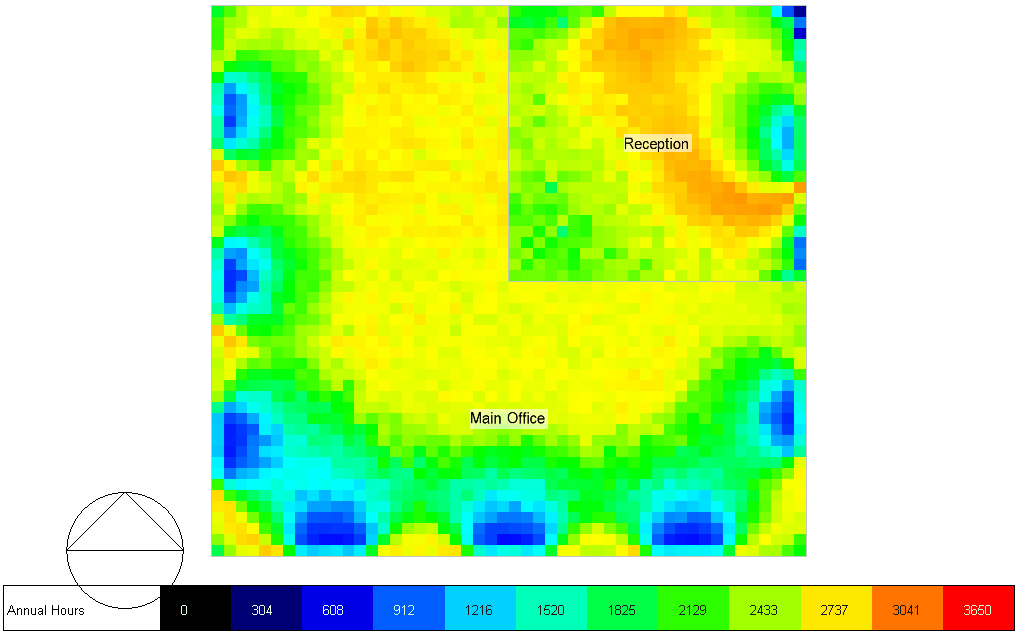
When the 2-ASE Map Option is selected, the distribution of ASE across the working plane for the current object is displayed.
The minimum working plane illuminance threshold is set under the Metric pass thresholds header in the Display options panel.
Useful Daylight Illuminance (UDI) is the annual occurrence of illuminance distribution across the working plane that are within a range considered “useful” by occupants. It excludes any times when there is inadequate natural daylight or excessive direct sunlight which would give rise to a risk of glare. UDI therefore not only provides information about useful daylight illuminance, but also on the propensity for excessive levels of daylight that are associated with glare, occupant discomfort and unwanted solar gains. In this way the single UDI metric can be used to summarise the overall daylight performance of a space.
More specifically, the UDI bins hourly time values based upon three illumination ranges which are typically, 0-100 lux, 100-2000 lux, and over 2000 lux. It provides full credit only to values between 100 lux and 2,000 lux, based on the assumption that horizontal illumination values outside of this range are not useful. The graphical percent values represent the percentage of the floor area that meets the UDI criteria at least 50% of the time.
A table of summary annual daylight statistics for each zone is displayed, including areas and % for each zone that satisfy the requirements of the sDA, ASE and UDI metrics.
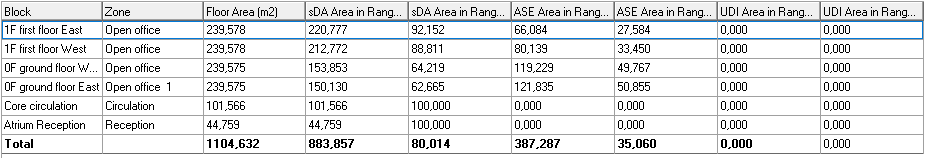
ASE Area in Range (m2 or ft2) - the area of the zone where the ASE meets the criteria set (typically 1000 lux), including the ASE illuminance threshold.
UDI Area in Range (m2 or ft2) - the area of the zone where the UDI meets the criteria set, including the UDI lower illuminance threshold and UDI upper illuminance threshold.