This section describes the available daylighting outputs and the corresponding Display options. The Display options panel at the bottom left of the screen is used to select which results are to be displayed.
Select the type of simulation results to be viewed. Generally, you should select the same Simulation type as selected on the Calculation options dialog.
The following options are available:
1-General - access results generated by any previous 1-General daylighting simulations that have been run.
2-LEED - provides access to LEED daylighting reports for any LEED v2 through to v4.1 including option 1 (annual) and option 2 (point in time) simulations that have been carried out.
3-BREEAM - provides access to BREEAM HEA Options 4a (point in time) and 4b (annual) reports.
4-LM-83-12 - the option to choose for sDA, ASE and UDI simulations when they are not for LEED or BREEAM.
5-Right to light (BS8206) - Annual probable sunlight hours (APSH), Vertical sky component (VSC), No sky line (NSL) and Average daylight factor (ADF) reports can be viewed.
6-Green Star - Green Star daylight factor reports.
These options together with their associated Display options are described in more detail below.
Note: The corresponding daylight simulation must have been carried out to view results for any of the above. For example, you will only see results for the 1-General simulation type if you have previously run a calculation using the equivalent 1-General Simulation type set on the Calculation Options dialog.
Several Daylighting Display options depend on the Simulation type selected as detailed in the topics listed below.
The options described below apply to all daylight map outputs.
This set of "Show.." object options are available when one of the map options has been selected.
Tick this checkbox if you would like building or block level component blocks to be displayed with the model.
Tick this checkbox if you would like assemblies to be displayed with the model.
Tick this checkbox if you would like shading planes to be displayed with the model.
Tick this checkbox if you would like the North arrow to be displayed on the ground plane.
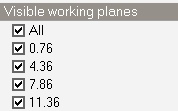
The Visible Working Planes settings are available when the Report type is set to one of the map options.
When viewing map data for a building, block or zone, there can be multiple working planes at various heights. DesignBuilder therefore provides a list of all relevant working plane heights in the current building, block or zone to allow you to select which are to be displayed. The working plane heights listed are relative to z=0 site ground level.
Selecting the All option toggles all working planes to be checked or unchecked depending on current state.
The Zone Labels settings are available when the Report type is set to one of the map options.
Check this option if you wish zones to be labelled with their name in the Map view.
The Cell Values settings are available when the Report type is set to one of the Map options.
Choose whether or not to show numeric values printed within each grid cell. Tick the checkbox to display numeric values.
Note: for small grid cells (or large spaces with lots of grid cells) there may not be enough space to comfortably fit the numeric values, in which case it is usually best to leave this option unchecked.
There are options to allow you to configure the font colour used to display cell value numeric text. Select from:
When the Font colour mode is set to 2-User specified you can select the font colour manually using this control.
The Colour settings are available when the Report type is set to one of the map options.
Select the palette to be used from the options: