Daylighting Display Options - BREEAM
This topic covers the Daylighting display options specific to the 3-BREEAM Simulation type.
Option
Select the reports you would like to display. Options for the 3-BREEAM Simulation type are:
-
1-Option 4a (point in time) - view BREEAM HEA 01 Option 4a results based on point in time daylight simulation.
-
2-Option 4b (annual) - view BREEAM HEA 01 Option 4b results based on an annual daylight simulation.
Report type
The report types available depend on the Option setting, above.
When the 1-Option 4a (point in time) Option setting is made, the following report types are available:
- 1-Map - a daylight distribution contour map on the working plane of the current object is displayed.
- 2-Grid - a table of summary daylight statistics for each zone is displayed.
- 3-Report - displays a report with a summary of the results and the number of credits that can be awarded for the selected calculation.
When the 2-Option 4b (annual) Option setting is made, the map results are not available and you can choose from the following report types:
- 1-Grid - a table of summary daylight statistics for each zone is displayed.
- 2-Report - displays a report with a summary of the results and the number of credits that can be awarded for the selected calculation.
Margin
Refer to the Margin help for the General Simulation type.
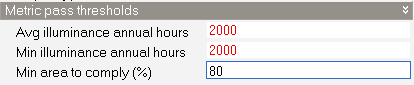
Metric Pass Thresholds (Annual)
When one of the grid or report types is set, the annual daylighting metric pass thresholds should be reviewed and, if necessary, changed.
The annual daylighting thresholds are used to define acceptability and are split into two parts:
-
the illuminance thresholds which define the acceptable level of lighting at any one point in time over the year, and are defined on the Calculation options dialog, and,
-
metric pass thresholds, which are defined here the Display options panel, as described below.
Changing any of the Metric pass threshold settings in the Display options will typically change the Area in Range values shown on the grid or report.
Avg illuminance annual hours
Enter the threshold to be compared with the count of hours failing the average illuminance criterion in each zone, in the HEA 01 Option 4b annual daylighting calculations. If less hours fail than the value entered here then the zone passes.
Min illuminance annual hours
Enter the threshold to be compared with the count of hours failing the minimum illuminance criterion in each zone, in the HEA 01 Option 4b annual daylighting calculations. If less hours fail than the value entered here then the zone passes.
Min area to comply (%)
Enter the minimum threshold for the occupied floor area that needs to comply for the overall building to comply.
Metric Pass Thresholds (Point in Time)
When viewing point in time results and one of the grid or report types is set, the illuminance daylighting pass thresholds should be checked and, if necessary, changed.
Threshold type
Select from:
-
1-Daylight factor, set the min average daylight factor threshold.
-
2-Illuminance, set the min and max illuminance threshold values.
Min average DF threshold
When the Threshold type is set to 1-Daylight factor, set the minimum average daylight factor to be used in calculating the Floor Area Within Limits grid outputs.
Min uniformity ratio
When the Report type is set to 3-Report set the minimum uniformity ratio to be used as a threshold for checking each zone.
Min point daylight factor
When the Threshold type is set to 1-Daylight factor, set the minimum average daylight factor to be used in calculating the Floor Area Within Limits grid outputs.
Min illuminance
When the Threshold type is set to 2-Illuminance, set the minimum illuminance to be used in calculating the Floor Area Within Limits grid outputs.
Max illuminance
When the Threshold type is set to 2-Illuminance, set the maximum illuminance to be used in calculating the Floor Area Within Limits grid outputs.
Min % area adequately daylit
Enter the minimum floor area than must be adequately daylit for the building to pass overall.
Scale
The Scale settings are available when the Report type is set to the map option. They provide control over how the map legend scale is defined.
Source
The scale of the daylight maps can be defined using data from the building, block or zone level or it can be entered manually. It is a way to define the minimum and maximum values on the scale. Select from one of the following options:
- 1-Building, where all of the values calculated for the whole building are scanned and the lowest and highest values are used. This allows plots to be generated using a consistent scale even when displaying data at block or zone level.
- 2-Block, where all of the values calculated for the current block are scanned and the lowest and highest values for are used. This allows plots to be generated using a consistent scale within a block even when displaying data at zone level.
- 3-Zone, where the scale is tailored to the current zone allowing in many cases a more even distribution of colours through the map. When using this option, images generated for each zone will use a different scale and so will not be so easily comparable as they would be if one of the 1-Building or 2-Block options had been used.
- 4-User defined, where you can enter the minimum and maximum values on the scale manually. This has the advantage of allowing a specific lower and upper scale value to be used. It also allows you to define colours to represent areas that exceed the maximum or are lower than the minimum. For example, in BREEAM option 4a point-in-time daylighting calculations, daylight factors lower than 2% are considered to be inadequately daylit. These areas can be highlighted in a special colour to help provide a clear visual indication of the compliant and non-compliant areas.
Value source
When the 2-Option 2 (point-in-time) Option setting is made, Value source defines whether to view Daylight factor or Illuminance results. Select from:
When the 1-Option 1 (annual) Option setting is made, Value source defines whether to view results as Annual hours or Percentage annual hours. Select from:
-
1-Annual hours - daylight distribution maps are plotted as the number of annual hours for which the selected criteria are met.
-
2-Percentage annual hours - daylight distribution maps are plotted as the % of annual hours for which the selected criteria are met. The denominator used in the % calculation is the total number of occupied hours.
Note: when Source is set to 4-User defined, Value source is hard set to 1-Annual hours.
 User-Defined Scale Settings
Low value
When using the 4-User defined Scale source you can enter the minimum scale value to be displayed. The units and meaning of this setting depend on the Value source setting, i.e. the data that is being plotted.
High value
When using the 4-User defined Scale source you can enter the maximum scale value to be displayed. The units and meaning of this setting depend on the Value source setting, i.e. the data that is being plotted.
Apply scale "too dark" colour
If you wish to set a specific colour to represent the areas of the working plane that have values below the entered Low value criterion then check this box and define the colour in the colour selector below.
Scale "too dark" colour
Select the colour to be used to represent areas of the working plane that are below the entered Low value. Typically a dark grey or black colour might be used to show areas of the working plane that are inadequately daylit.
Apply scale "too bright" colour
If you wish to set a specific colour to represent areas of the working plane that are above the entered High value then check this box and define the colour in the colour selector below.
Scale "too bright" colour
Select the colour to be used to represent areas of the working plane that are above the entered High value.
BREEAM Option 4a Results
This section summarises the results generated when the 1-Option 4a (point in time) Option setting is made.
BREEAM HEA 01 4a Map Output
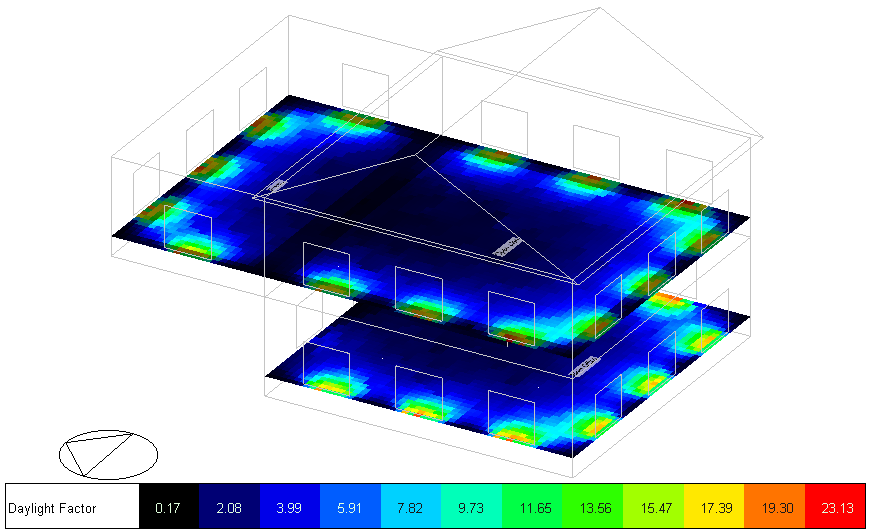
The distribution of daylight factors across the working plane can be displayed in map form by setting the Report type to 1-Map. In this case, the minimum working plane daylight factor threshold is set to 2% behind the scenes.
The screenshot below shows an example of an Option 4a map output.
BREEAM HEA 01 4a Grid Output
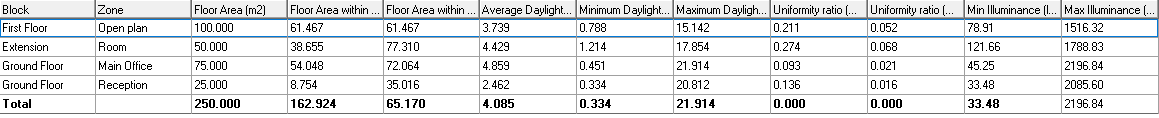
The grid output for BREEAM HEA 01 Option 4a can be viewed by setting the Report type to 2-Grid. It summarises the daylighting performance of each zone in terms of minimum and maximum daylight factor and illuminance values. Uniformity ratios are provided as minimum/average and minimum/maximum.
The following data is listed for each zone:
- Floor Area (m2 or ft2)
- Floor Area within Limits (m2 or ft2) - the floor area that is within the min/max illuminance or daylight factor limits set on the Display Options panel.
- Floor Area within Limits (%) - the % floor area that is within the min/max illuminance or daylight factor limits set on the Display Options panel.
- Average Daylight Factor (%)
- Minimum Daylight Factor (%)
- Maximum Daylight Factor (%)
- Uniformity ratio (Min / Avg)
- Uniformity ratio (Min / Max)
- Min Illuminance (lux or fc)
- Max Illuminance (lux or fc)
This option can be especially useful if the built-in daylight reports don't cover the particular calculation you need to make. In this case you can export the summary data for each zone for further analysis in a spreadsheet.
An example grid output is shown below.
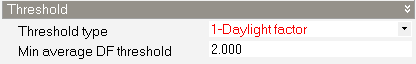
Before viewing grid results, you should ensure that the Threshold set in Display Options defines a minimum daylight factor of 2%:
BREEAM HEA 01 4a Report
A report detailing eligibility for the BREEAM HEA 01 Option 4a can be viewed by setting the Report type to 3-Report. These daylighting credits are available based on % area of the occupied part of the building that has better than minimum daylight factors plus better than minimum uniformity ratios.
Specifically, for each zone, a pass requires that at least 80% of net lettable floor area in occupied spaces is adequately daylit on the working plane, 0.7m above the floor under a uniform CIE overcast design sky. A zone is adequately daylit if both the following conditions are met:
-
Average daylight factor is at least 2.0%.
-
A uniformity ratio of at least 0.3 or a minimum point daylight factor of 0.8%.
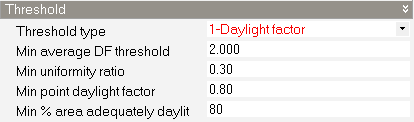
You should define the required thresholds before viewing the report by ensuring that the settings under the Threshold header in the Display Options panel are as follows:
See screenshot below.
These thresholds can be adjusted for cases that are different from the default.
BREEAM Option 4b Results
This section summarises the results generated when the 1-Option 4b (annual) Option setting is made.
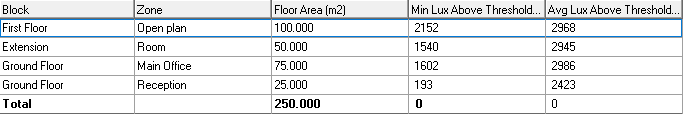
BREEAM HEA 01 4b Grid Output
The grid output for BREEAM HEA 01 Option 4b can be viewed by setting the Report type to 1-Grid. It summarises the daylighting performance of each zone in terms of number of hours over the year where the minimum illuminance is above the Min illuminance threshold and the average illuminance is above the the Avg illuminance threshold. These thresholds are set on the Calculations options dialog.
The following data is listed for each zone:
- Floor Area (m2 or ft2)
- Min Lux Above Threshold (hr) - the number of hours over the year where the minimum illuminance is above the Min illuminance threshold.
- Avg Lux Above Threshold (hr) - the number of hours over the year where the average illuminance is above the Avg illuminance threshold.
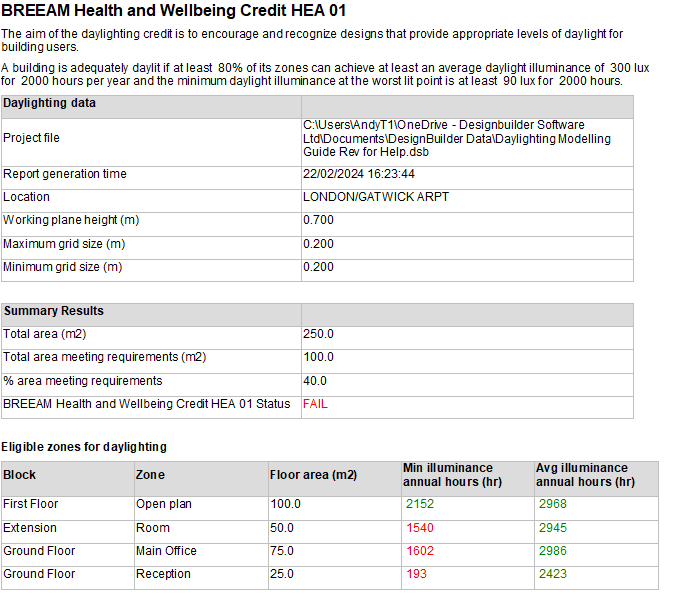
BREEAM HEA 01 4b Report
A report detailing eligibility for the BREEAM HEA 01 Option 4b can be viewed by setting the Report type to 2-Report.
Option 4b considers that a building is adequately daylit if at least 80% of its zones can achieve at least an average daylight illuminance of 300 lux for 2000 hours per year and the minimum daylight illuminance at the worst lit point is at least 90 lux for 2000 hours.
You should define the required thresholds before viewing the report by ensuring that the settings under the Metric pass thresholds header in the Display Options panel are as follows:
See screenshot below.
These thresholds can be adjusted for cases that are different from the default.