Daylighting Display Options - LEED
This topic covers the Daylighting display options specific to the 2-LEED Simulation type.
LEED version
Having selected the 2-LEED Simulation type, the version of LEED should be selected. Choose from:
-
1-LEED v2 - for NC 2.2 Credit EQ 8.1 (LEED v2).
-
2-LEED v3 - for Daylighting BD+C: New Construction v3.
-
3-LEED v4 - for Daylighting BD+C: New Construction, Options 1 and 2.
-
4-LEED v4.1 - for EQ Credit, Options 1 and 2.
Option
For LEED v4 and v4.1 you can choose to display results for Option 1 or Option 2. Select from:
-
1-Option 1 (annual) - view LEED Daylighting BD+C: New Construction, Option 1 results.
-
2-Option 2 (point in time) - view LEED Daylighting BD+C: New Construction, Option 2 results.
Report type
The report types available depend on the LEED version and Option settings.
When the 1-Option 1 (annual) Option setting is made (for LEED versions 3-LEED v4 or 4-LEED v4.1), the following report types are available:
- 1-sDA map - shows the distribution of annual hours on the working plane for which the sDA (Spatial Daylight Autonomy) criteria are met.
- 2-ASE map - shows the distribution of annual hours on the working plane for which the ASE (Annual Sunlight Exposure) criteria are met.
- 3-Grid - a table of summary annual daylight statistics is displayed for each zone.
- 4-Report - displays a report with a summary of the results and the number of credits that can be awarded for the selected calculation.
When the 2-Option 1 (point in time) Option setting is made and LEED version is set to 3-LEED v4 or 4-LEED v4.1, or when the LEED version is set to 1-LEED v2 or 2-LEED v3, the following report types are available:
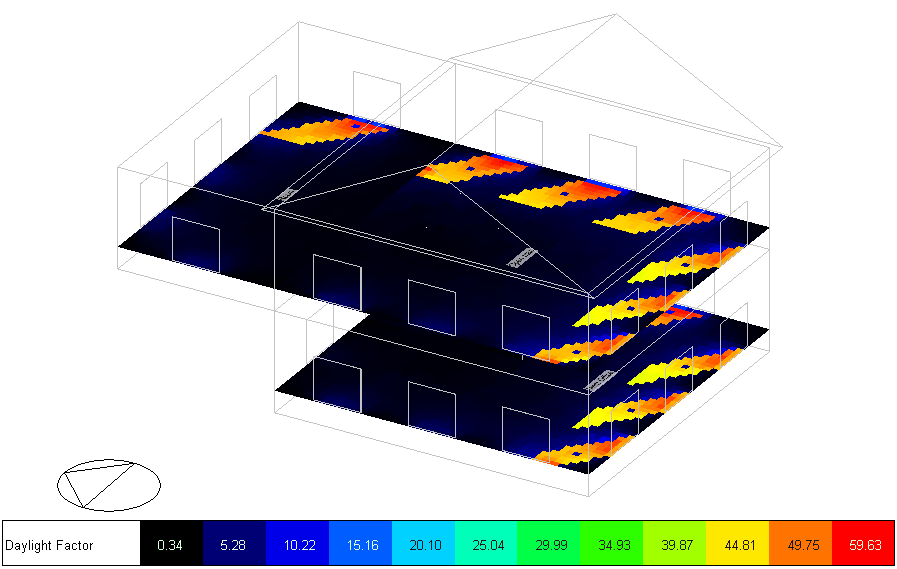
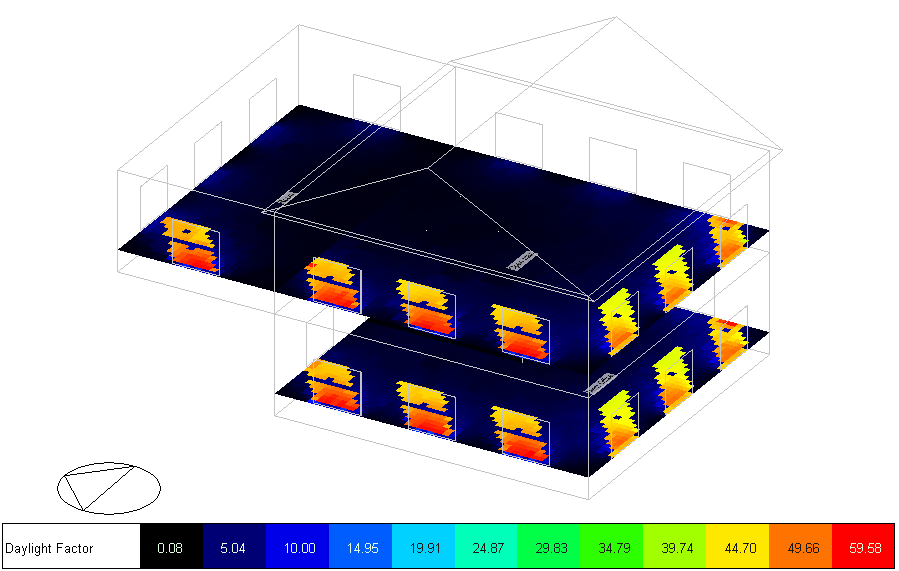
- 1-Map - a daylight factor or illuminance distribution contour map on the working plane of the current object is displayed.
- 2-Grid - a table of summary daylight statistics for each zone is displayed.
- 3-Report - displays a report with a summary of the results and the number of credits that can be awarded for the selected calculation.
Clear sky time (LEED v3 only)
When the LEED version is set to 2-LEED v3 and a LEED v3 calculation has been carried out, 2 sets of illuminance maps will be stored, one for 9 am and the other for 3 pm. You can select which of these to display using the Clear sky time display option. Choose from the following options:
-
1-AM 9:00 - 21 Sep
-
2-PM 15:00 21 Sep
Construction type
When displaying a report output for LEED v4 or v4.1 Option 1, you must first select the appropriate Construction type to ensure that the right floor area thresholds are used in the calculation of credits. Choose from:
-
1-New Construction
-
2-Core and Shell
-
3-School
-
4-Retail
-
5-Data Centre
-
6-Warehouse
-
7-Hospitality
Credits are calculated based on the table below.
Points for daylit floor area: Spatial daylight autonomy
| New Construction, Core and Shell, Schools, Retail, Data Centers, Warehouses & Distribution Centers, CI, Hospitality |
Healthcare |
|
sDA (for regularly occupied floor area)
|
Points |
sDA (for perimeter floor area)
|
Points
|
| 55% |
2 |
75% |
1 |
| 75% |
3 |
90% |
2 |
Margin
Refer to the Margin help for the General Simulation type.
Metric Pass Thresholds (Annual)
When one of the grid or report types is set, the annual daylighting metric pass thresholds should be reviewed and, if necessary, changed.
Note: The annual daylighting thresholds are used to define acceptability and are split into two parts:
a. the illuminance thresholds which define the acceptable level of lighting at any one point in time over the year, and are defined on the Calculation options dialog, and,
b. metric pass thresholds, which are defined here the Display options panel, as described below.
Changing any of the Metric pass threshold settings in the Display options will typically change the Area in Range values shown on the grid or report.
sDA percentage annual hours
Enter the % of the occupied year pass threshold used for each cell in the sDA calculations. sDA is usually defined as sDA 300,50%, which means that a given grid cell must achieve at least 300 lux (sDA lower illuminance threshold) for at least 50% (sDA Percentage annual hours) of the occupied year for its area to be considered to "pass" the criteria. The overall sDA metric for a zone is the % of its floor area that passes in this way.
ASE annual hours
Enter the number of occupied hours in the year pass threshold used for each cell in the ASE calculations. The default is 250 hours. ASE 1000,250 means, for a given cell, the illuminance must not be greater than the 1000 lux threshold (ASE illuminance threshold) for more than 250 hours (ASE annual hours) in the (occupied) year to pass.
Metric Pass Thresholds (Point in Time)
When viewing point in time results and one of the grid or report types is set, the illuminance daylighting pass thresholds should be checked and, if necessary, changed.
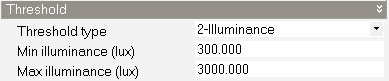
Threshold type
Select from:
-
1-Daylight factor, set the min average daylight factor threshold.
-
2-Illuminance, set the min and max illuminance threshold values.
Min average DF threshold
When the Threshold type is set to 1-Daylight factor, set the minimum average daylight factor to be used in calculating the Floor Area Within Limits grid outputs.
Min illuminance
When the Threshold type is set to 2-Illuminance, set the minimum illuminance to be used in calculating the Floor Area Within Limits grid outputs.
Max illuminance
When the Threshold type is set to 2-Illuminance, set the maximum illuminance to be used in calculating the Floor Area Within Limits grid outputs.
Scale
The Scale settings are available when the Report type is set to one of the map options. They provide control over how the map legend scale is defined.
Source
The scale of the daylight maps can be defined using data from the building, block or zone level or it can be entered manually. It is a way to define the minimum and maximum values on the scale. Select from one of the following options:
- 1-Building, where all of the values calculated for the whole building are scanned and the lowest and highest values are used. This allows plots to be generated using a consistent scale even when displaying data at block or zone level.
- 2-Block, where all of the values calculated for the current block are scanned and the lowest and highest values for are used. This allows plots to be generated using a consistent scale within a block even when displaying data at zone level.
- 3-Zone, where the scale is tailored to the current zone allowing in many cases a more even distribution of colours through the map. When using this option, images generated for each zone will use a different scale and so will not be so easily comparable as they would be if one of the 1-Building or 2-Block options had been used.
- 4-User defined, where you can enter the minimum and maximum values on the scale manually. This has the advantage of allowing a specific lower and upper scale value to be used. It also allows you to define colours to represent areas that exceed the maximum or are lower than the minimum. For example, LEED Option 2 states that areas of the working plane where illuminance is lower than 300 lux are inadequately daylit. Likewise, areas of the working plane where illuminance is higher than 3,000 lux are considered to be subject to glare. These areas can be highlighted in special colours to help provide a clear visual indication of the compliant and non-compliant areas.
Value source
When the 2-Option 2 (point-in-time) Option setting is made, Value source defines whether to view Daylight factor or Illuminance results. Select from:
When the 1-Option 1 (annual) Option setting is made, Value source defines whether to view results as Annual hours or Percentage annual hours. Select from:
-
1-Annual hours - daylight distribution maps are plotted as the number of annual hours for which the selected criteria are met.
-
2-Percentage annual hours - daylight distribution maps are plotted as the % of annual hours for which the selected criteria are met. The denominator used in the % calculation is the total number of occupied hours.
Note: when Source is set to 4-User defined, Value source is hard set to 1-Annual hours.
 User-Defined Scale Settings
Low value
When using the 4-User defined Scale source you can enter the minimum scale value to be displayed. The units and meaning of this setting depend on the Value source setting, i.e. the data that is being plotted.
High value
When using the 4-User defined Scale source you can enter the maximum scale value to be displayed. The units and meaning of this setting depend on the Value source setting, i.e. the data that is being plotted.
Apply scale "too dark" colour
If you wish to set a specific colour to represent the areas of the working plane that have values below the entered Low value criterion then check this box and define the colour in the colour selector below.
Scale "too dark" colour
Select the colour to be used to represent areas of the working plane that are below the entered Low value. Typically a dark grey or black colour might be used to show areas of the working plane that are inadequately daylit.
Apply scale "too bright" colour
If you wish to set a specific colour to represent areas of the working plane that are above the entered High value then check this box and define the colour in the colour selector below.
Scale "too bright" colour
Select the colour to be used to represent areas of the working plane that are above the entered High value.
LEED Version-Dependent Settings
LEED v4.1
LEED v4.1 Option 1 (Annual) Results
This section summarises the results generated when the 1-Option 1 (annual) Option setting is made.
LEED v4.1 Option 1 Map Outputs
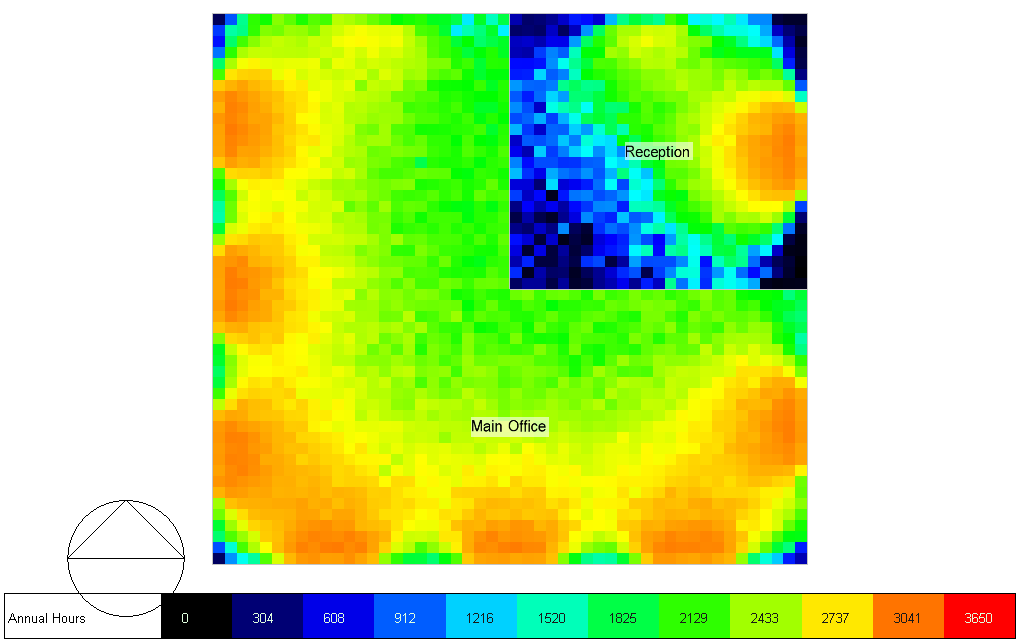
When the LEED v4.1 version is set, the distribution of sDA and ASE results on the working plane can be displayed in map form by setting the Report type to 1-SDA Map or 2-ASE Map.
-
When the 1-sDA Map Option is selected, the distribution of sDA across the working plane for the current object is displayed. The main metric, sDA 300/50%, used in LEED v4.1 Option 1 daylighting calculations represents the percentage of the floor area that exceeds 300 lux for at least 50% of the occupied time. Unoccupied periods are ignored.
The minimum working plane illuminance threshold is set to 300 lux behind the scenes. If you need to use a different threshold then you should select the 1-General Simulation type instead of 2-LEED.
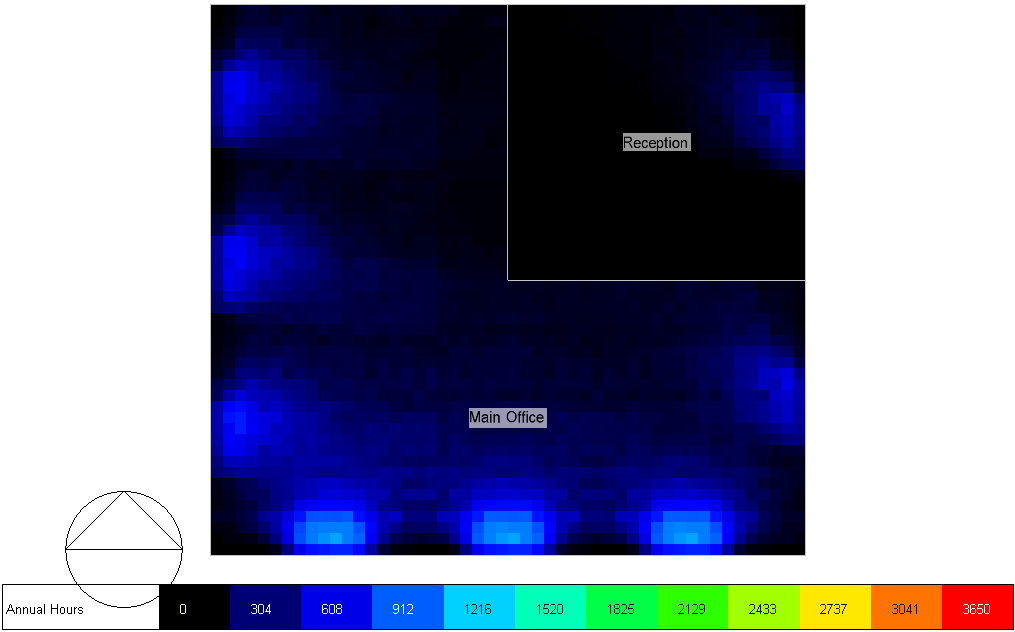
-
When the 2-ASE Map Option is selected, the distribution of ASE across the working plane for the current object is displayed. The main glare metric used in LEED v4.1, ASE 1000/250, represents the percentage of the floor area that exceeds 1000 lux for 250 or more occupied hours over the year. For any regularly occupied spaces with ASE 1000,250 greater than 10% (ASE % Area in Range of 90% or more), it is necessary to identify how the space is designed to address glare.
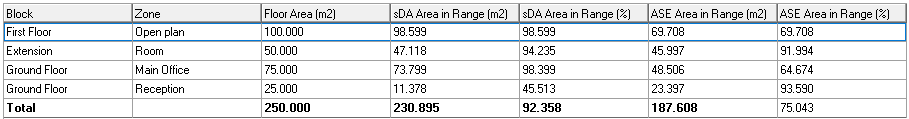
LEED v4.1 Option 1 Grid Outputs
To view a summary of the areas and % areas that meet the sDA and ASE requirements set the Report type to 3-Grid.
The grid output for LEED v4.1 Option 1 summarises the daylighting performance of each zone in terms of areas and % areas that meet the sDA and ASE requirements.
Before viewing results, you should check the Metric pass thresholds set in Display options. sDA percentage annual hours should be set to 50 and ASE annual hours should be set to 250.
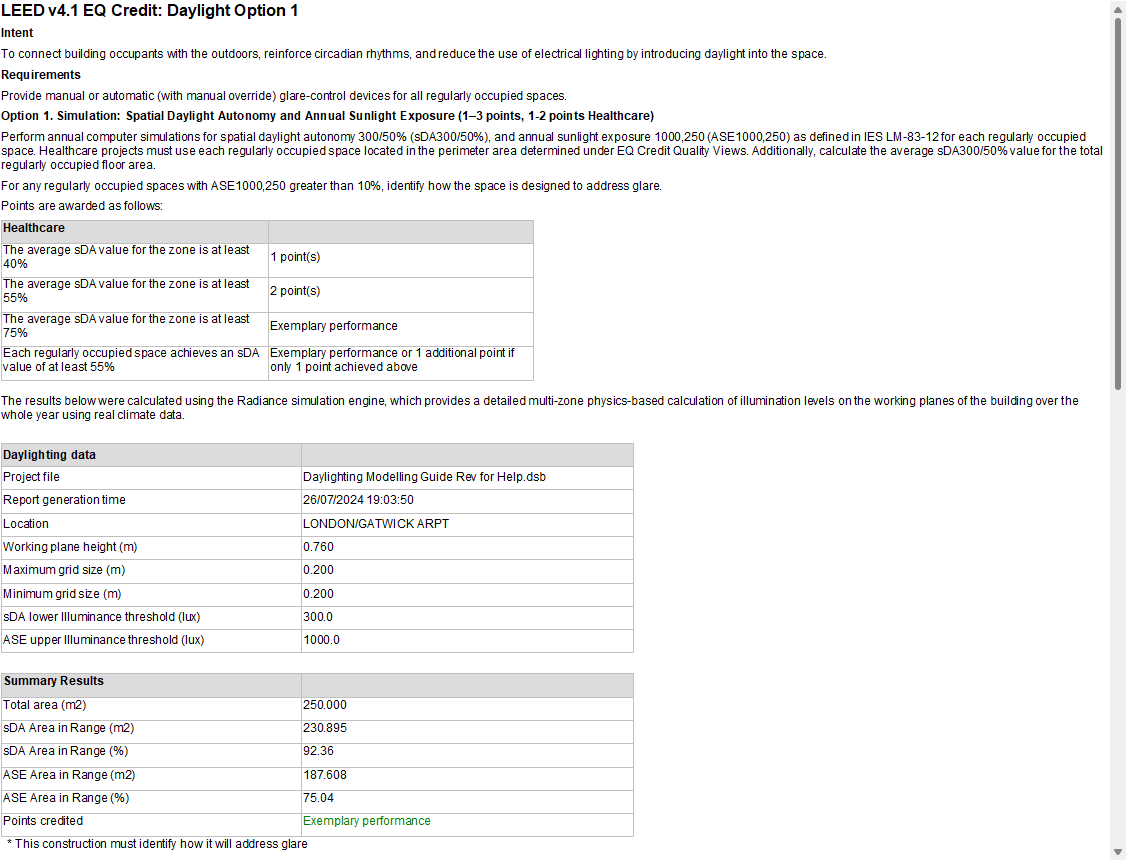
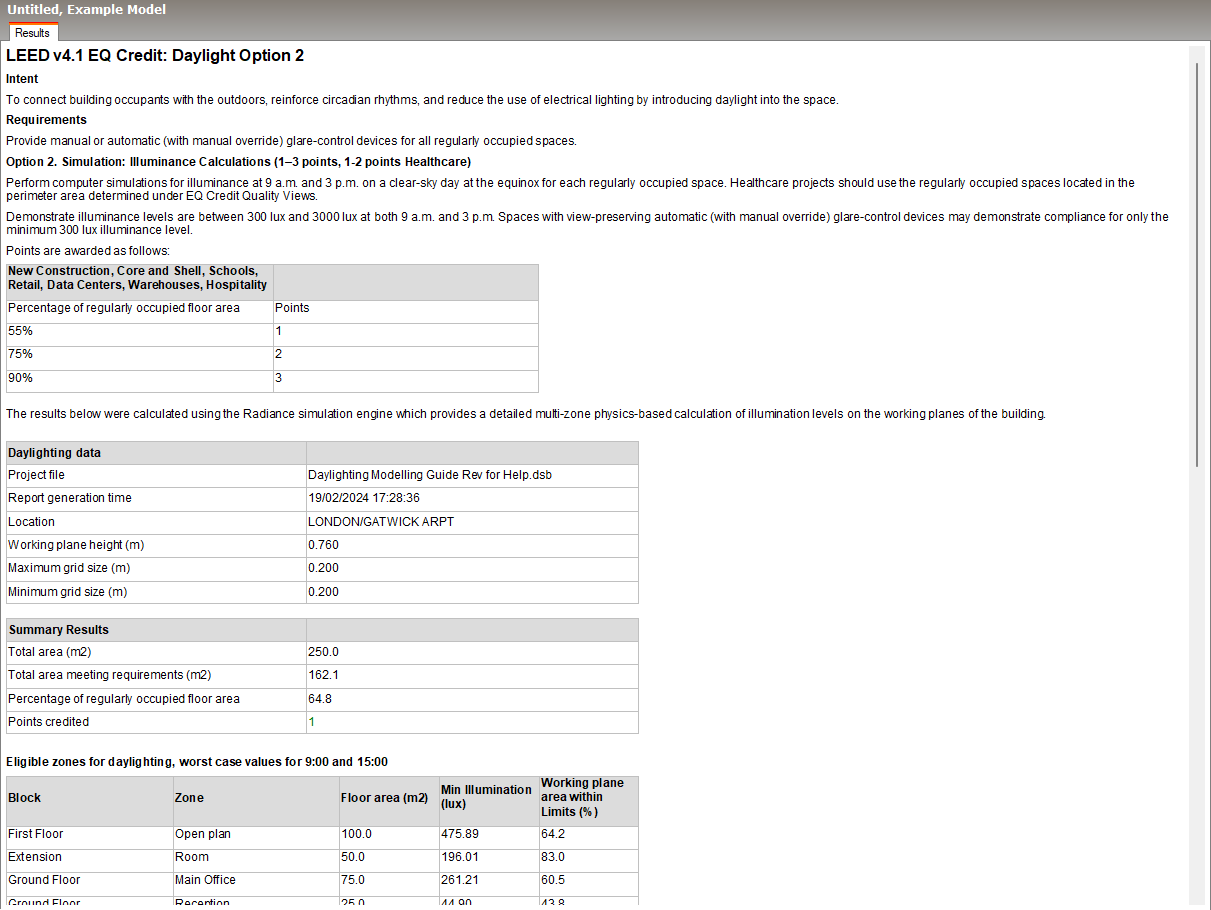
Report for LEED v4.1 Option 1 Daylighting BD+C
A report that can be used towards obtaining LEED v4.1 Option 1 daylighting BD+C points through a combination of sDA and ASE metrics. The report includes background information about the requirements as can be seen in the example report below.
When generating a report for LEED v4.1 Option 1, the first step is to select the appropriate Construction type to ensure that the right thresholds are used in the calculation of credit points.
Before viewing results, you should check the Metric pass thresholds set in Display options. sDA percentage annual hours should be set to 50 and ASE annual hours should be set to 250.
LEED v4.1 Option 2 (Point in Time) Results
This section explains the results generated when the 2-Option 2 (point in time) Option setting is made.
LEED v4.1 Option 2 Map Outputs
Use the Clear sky time setting to request results for morning or afternoon. The options are:
-
1-AM 9:00 - 21 Sep
-
2-PM 15:00 - 21 Sep
LEED v4.1 Option 2 Grid Output
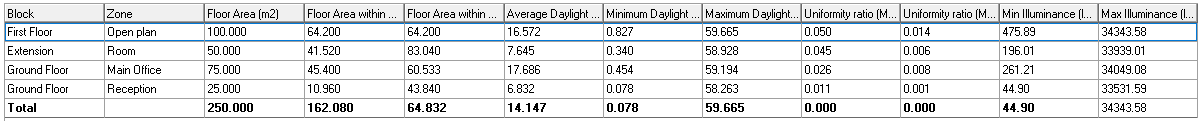
The grid output for LEED v4.1 Option 2 summarises the daylighting performance of each zone in terms of minimum and maximum daylight factor and illuminance values. Uniformity ratios are provided as minimum/average and minimum/maximum.
The following data is calculated for each zone:
- Floor Area (m2 or ft2)
- Floor Area within Limits (m2 or ft2) - the floor area that is within the min/max illuminance or daylight factor limits set on the Display Options panel.
- Floor Area within Limits (%) - the % floor area that is within the min/max illuminance or daylight factor limits set on the Display Options panel.
- Average Daylight Factor (%)
- Minimum Daylight Factor (%)
- Maximum Daylight Factor (%)
- Uniformity ratio (Min / Avg)
- Uniformity ratio (Min / Max)
- Min Illuminance (lux or fc)
- Max Illuminance (lux or fc)
This option can be especially useful if the built-in daylight reports don't cover the particular calculation you need to make. In this case you can export the summary data for each zone for further analysis in a spreadsheet.
An example grid output is shown below.
Before viewing grid results, you should ensure that the Thresholds set in Display Options define minimum and maximum illuminance values of 300 lux and 3,000 lux respectively:
LEED v4.1 Option 2 Report
A report is generated detailing eligibility for the LEED v4.1 daylighting points for Option 2 based on % area of the occupied part of the building that has daylight factor between 300 and 3,000 lux at 9 am and 3 pm. LEED v4.1 Option 2 requires two calculations using clear day conditions recorded for the nearest weather station to the site, the first within 15 days of September 21 and the second within 15 days of March 21.
The easiest way to achieve this is described under LEED v4 Option 2 Sky Settings in the Calculation options help.
When reporting cell values in grid and report views, the minimum, maximum, or average cell value is calculated and applied as summarised below:
-
The minimum value for each cell of the two simulations is recorded if it is lower than the lower threshold.
-
The maximum value for each cell of the two simulations is recorded if it is higher than the upper threshold.
-
Otherwise, the average value of the two simulations is recorded if both values for the cell are within the threshold limits.
Before viewing the report, you should ensure that the Thresholds set in Display options define minimum and maximum illuminance values of 300 lux and 3,000 lux respectively:
LEED v4
LEED v4 Option 1 (Annual) Results
This section summarises the results generated when the 1-Option 1 (annual) Option setting is made.
LEED v4 Option 1 Map Outputs
When the LEED v4 version is set, the distribution of sDA and ASE results on the working plane can be displayed in map form by setting the Report type to 1-SDA Map or 2-ASE Map.
-
When the 1-sDA Map Option is selected, the distribution of sDA across the working plane for the current object is displayed. The main metric, sDA 300/50%, used in LEED v4.1 Option 1 daylighting calculations represents the percentage of the floor area that exceeds 300 lux for at least 50% of the occupied time. Unoccupied periods are ignored.
The minimum working plane illuminance threshold is set to 300 lux behind the scenes. If you need to use a different threshold then you should select the 1-General Simulation type instead of 2-LEED.
-
When the 2-ASE Map Option is selected, the distribution of ASE across the working plane for the current object is displayed. The main glare metric used in LEED v4, ASE 1000/250, represents the percentage of the floor area that exceeds 1000 lux for 250 or more occupied hours over the year. For any regularly occupied spaces with ASE 1000,250 greater than 10% (ASE % Area in Range of 90% or more), it is necessary to identify how the space is designed to address glare.
LEED v4 Option 1 Grid Outputs
To view a summary of the areas and % areas that meet the sDA and ASE requirements set the Report type to 3-Grid.
The grid output for LEED v4 Option 1 summarises the daylighting performance of each zone in terms of areas and % areas that meet the sDA and ASE requirements.
Before viewing results, you should check the Metric pass thresholds set in Display options. sDA percentage annual hours should be set to 50 and ASE annual hours should be set to 250.
You can also use the ASE Min area Display option to allow very small zones to pass ASE criteria when required. To avoid small zones failing the ASE criteria, enter the minimum floor area for zones to be checked for ASE. Enter zero if you don't want this facility to be used.
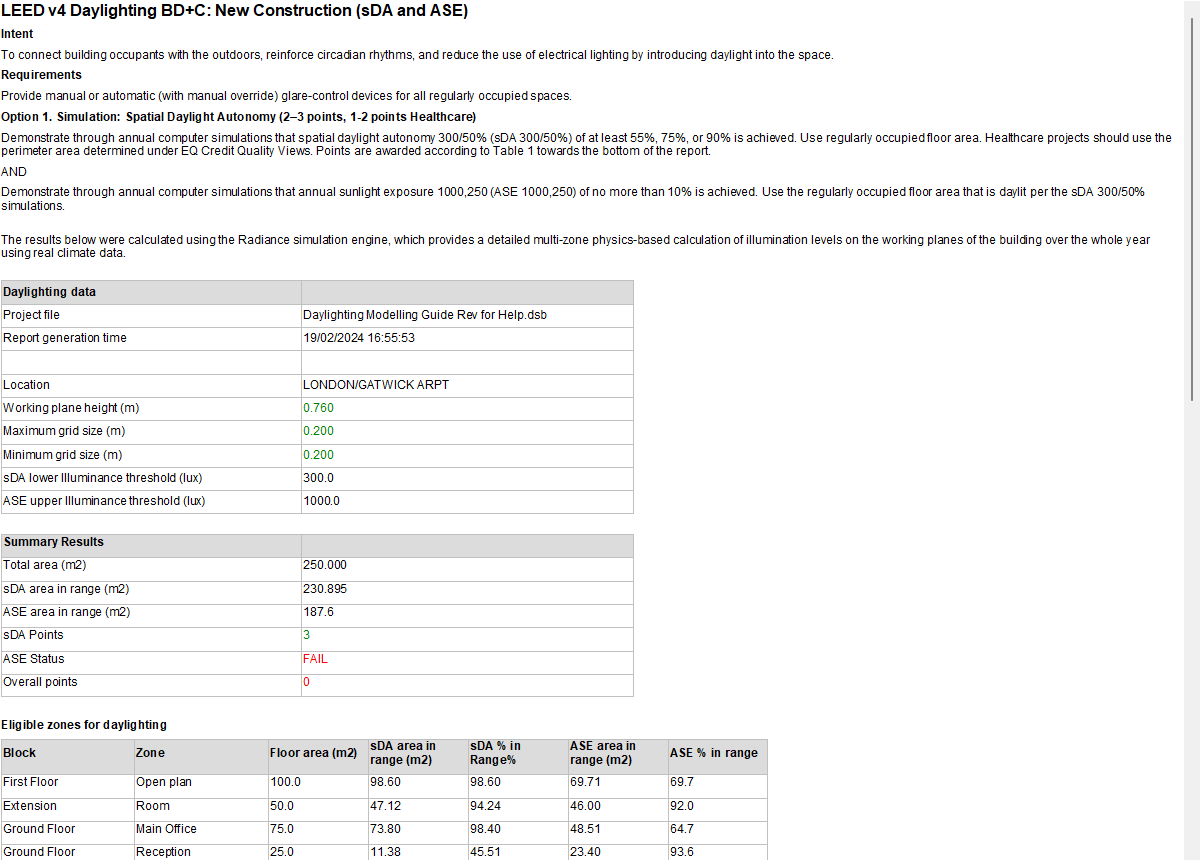
Report for LEED v4 Option 1 Daylighting BD+C
A report that can be used towards obtaining LEED v4 Option 1 daylighting BD+C points through a combination of sDA and ASE metrics. The report includes background information on the requirements as can be seen in the example report below.
When generating a report for LEED v4 Option 1, the first step is to select the appropriate Construction type to ensure that the right thresholds are used in the calculation of credit points.
Before viewing results, you should check the Metric pass thresholds set in Display options. sDA percentage annual hours should be set to 50 and ASE annual hours should be set to 250.
You can also use the ASE Min area Display option to allow very small zones to pass ASE criteria when required. To avoid small zones failing the ASE criteria, enter the minimum floor area for zones to be checked for ASE. Enter zero if you don't want this facility to be used.
LEED v4 Option 2 (Point in Time) Results
This section explains the LEED v4 results generated when the 2-Option 2 (point in time) Option setting is made.
LEED v4 Option 2 Map Outputs
Use the Clear sky time setting to request results for morning or afternoon. The options are:
-
1-AM 9:00 - 21 Sep
-
2-PM 15:00 - 21 Sep
LEED v4 Option 2 Grid Output
The grid output for LEED v4 Option 2 summarises the daylighting performance of each zone in terms of minimum and maximum daylight factor and illuminance values. Uniformity ratios are provided as minimum/average and minimum/maximum.
The following data is calculated for each zone:
- Floor Area (m2 or ft2)
- Floor Area within Limits (m2 or ft2) - the floor area that is within the min/max illuminance or daylight factor limits set on the Display Options panel.
- Floor Area within Limits (%) - the % floor area that is within the min/max illuminance or daylight factor limits set on the Display Options panel.
- Average Daylight Factor (%)
- Minimum Daylight Factor (%)
- Maximum Daylight Factor (%)
- Uniformity ratio (Min / Avg)
- Uniformity ratio (Min / Max)
- Min Illuminance (lux or fc)
- Max Illuminance (lux or fc)
This option can be especially useful if the built-in daylight reports don't cover the particular calculation you need to make. In this case you can export the summary data for each zone for further analysis in a spreadsheet.
An example grid output is shown below.
Before viewing grid results, you should ensure that the thresholds set in Display Options define minimum and maximum illuminance values of 300 lux and 3,000 lux respectively:
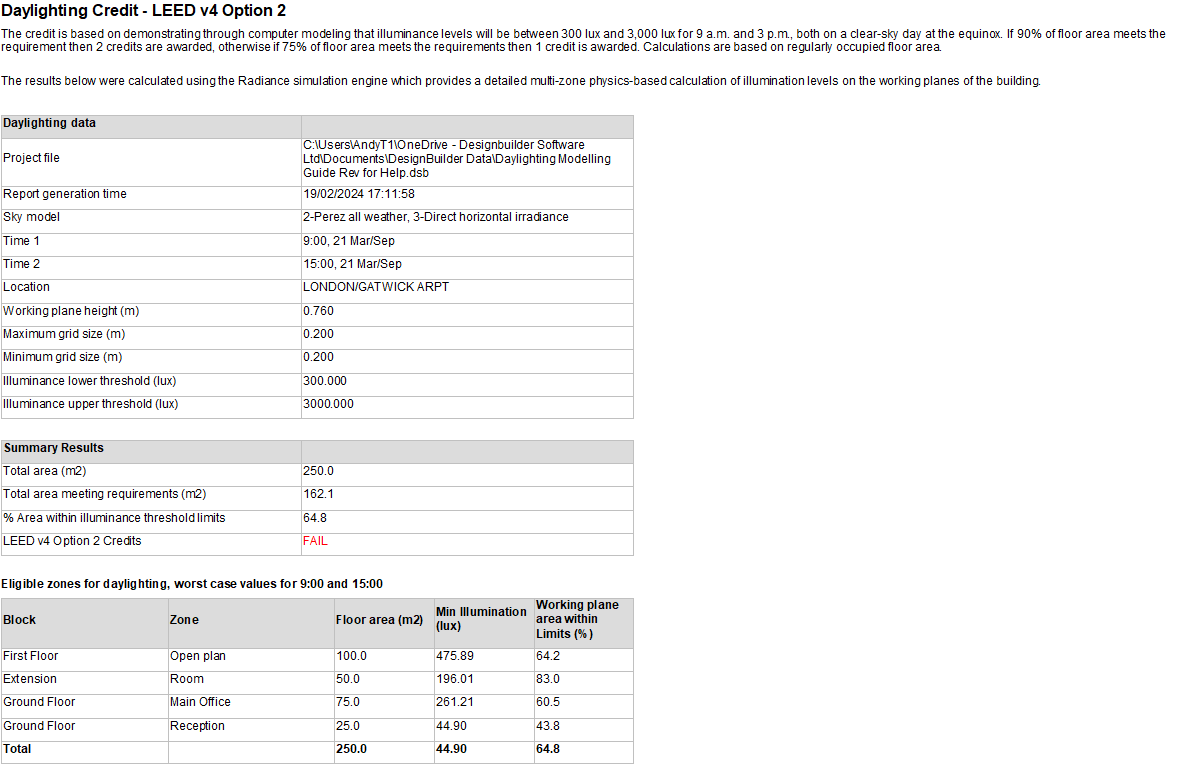
LEED v4 Option 2 Report
A report is generated detailing eligibility for the LEED v4 daylighting points for Option 2 based on % area of the occupied part of the building that has daylight factor between 300 and 3,000 lux at 9 am and 3 pm. LEED v4 Option 2 requires two calculations using clear day conditions recorded for the nearest weather station to the site, the first within 15 days of September 21 and the second within 15 days of March 21. The average of the two hourly values are used in the calculations. The easiest way to achieve this is described under LEED v4 Option 2 Sky Settings in the Calculation options help.
Before viewing the report, you should ensure that the Thresholds set in Display options define minimum and maximum illuminance values of 300 lux and 3,000 lux respectively:
LEED v3
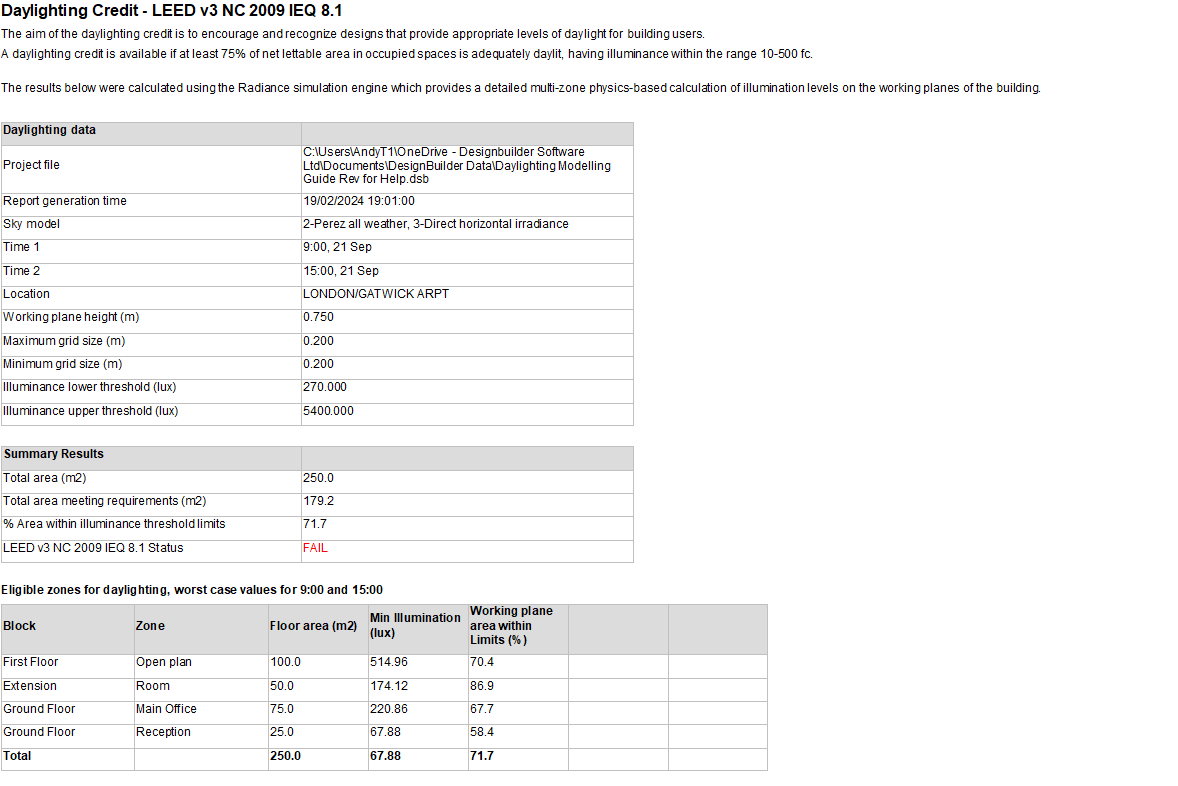
LEED v3 NC 2009 IEQ 8.1 Results
LEED v3 requires computer simulations to demonstrate that the applicable spaces achieve daylight illuminance levels of a minimum of 10 footcandles (fc) (108 lux) and a maximum of 500 fc (5,400 lux) in a clear sky condition on September 21 at 9 a.m. and 3 p.m. DesignBuilder provides a report to summarise the building's compliance with these requirements, but you can also drill down to see detailed daylight performance for each zones.
This section summarises the results generated when the 2-LEED v3 Version setting is made.
LEED v3 Map Outputs
Use the Clear sky time setting to request results for morning or afternoon. The options are:
-
1-AM 9:00 - 21 Sep
-
2-PM 15:00 - 21 Sep
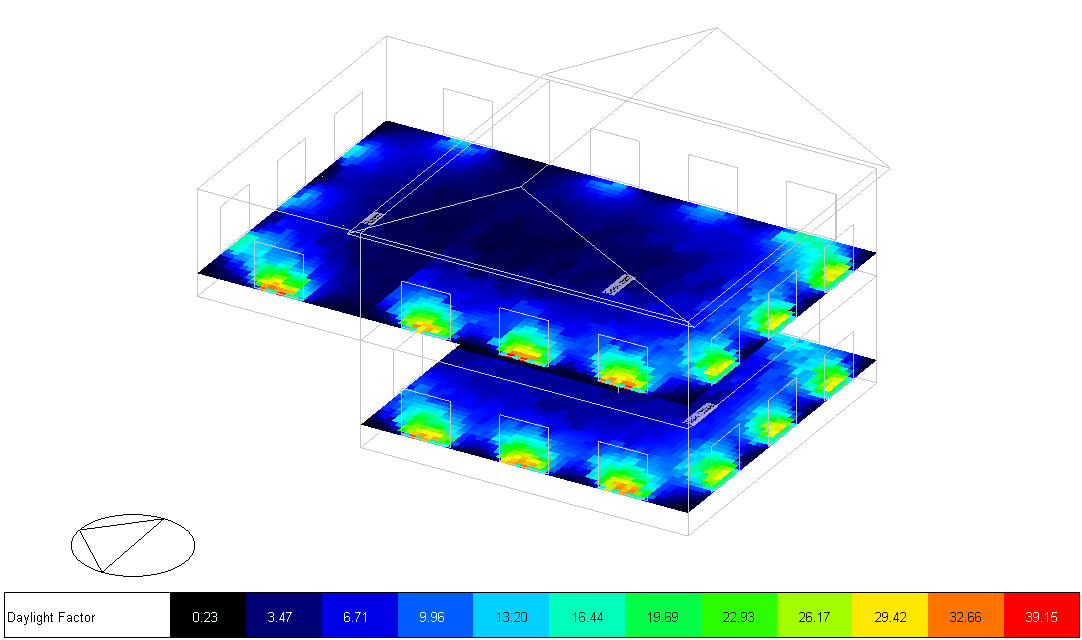
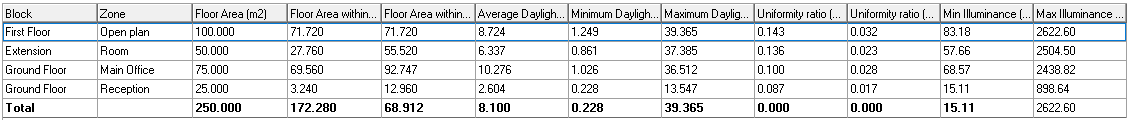
LEED v3 Grid Outputs
The grid output for LEED v3 summarises the daylighting performance of each zone in terms of minimum and maximum daylight factor and illuminance values. Uniformity ratios are provided as minimum/average and minimum/maximum.
The following data is calculated for each zone:
- Floor Area (m2 or ft2)
- Floor Area within Limits (m2 or ft2) - the floor area that is within the min/max illuminance or daylight factor limits set on the Display Options panel.
- Floor Area within Limits (%) - the % floor area that is within the min/max illuminance or daylight factor limits set on the Display Options panel.
- Average Daylight Factor (%)
- Minimum Daylight Factor (%)
- Maximum Daylight Factor (%)
- Uniformity ratio (Min / Avg)
- Uniformity ratio (Min / Max)
- Min Illuminance (lux or fc)
- Max Illuminance (lux or fc)
This option can be especially useful if the built-in daylight reports don't cover the particular calculation you need to make. In this case you can export the summary data for each zone for further analysis in a spreadsheet.
An example grid output is shown below.
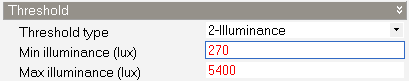
Before viewing grid results, you should ensure that the Thresholds set in Display Options define minimum and maximum illuminance values of 270 lux and 5,400 lux respectively:
LEED v3 Credit EQ8.1 Report
A report is generated detailing eligibility for the LEED v3 daylighting credit EQ8.1 based on % area of the occupied part of the building that has better than the minimum required daylight factor. LEED v3 EQ8.1 requires 2 calculations using CIE clear day conditions at 9am and 3pm on 21 September. When the LEED v3 calculation option is selected these calculations are carried out automatically.
An example LEED v3 daylight report is shown below.
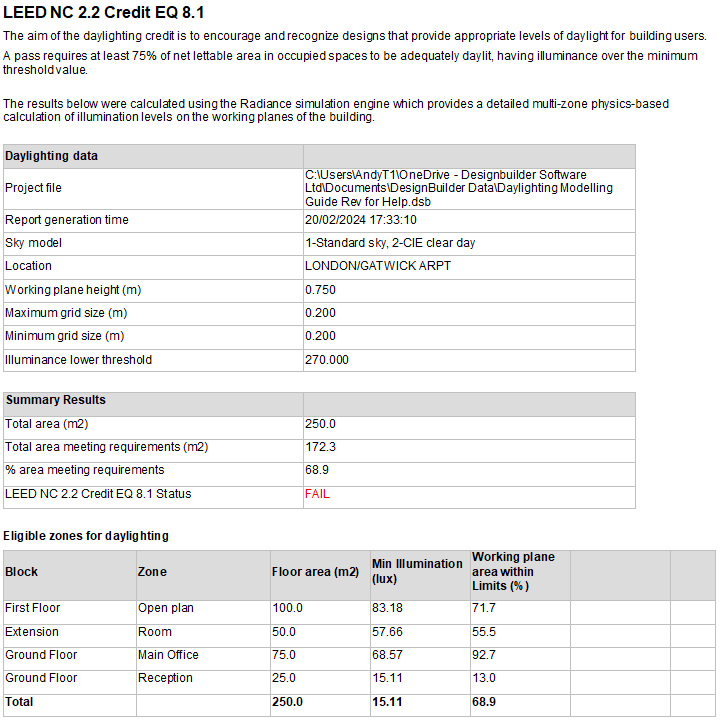
LEED v2
LEED v2 NC 2. EQ 8.1 Results
LEED v2 requires computer simulations to demonstrate that the applicable spaces achieve daylight illuminance levels of a minimum of 10 footcandles (fc) (108 lux) in a clear sky condition on September 21 at 9 a.m. and 3 p.m. DesignBuilder provides a report to summarise the building's compliance with these requirements, but you can also drill down to see detailed daylight performance for each zones.
LEED v2 Map Results
With LEED v2, the calculations for morning and afternoon need to be run separately. Likewise, results must be reviewed separately.
LEED v2 Grid Results
The grid output for LEED v2 summarises the daylighting performance of each zone in terms of minimum and maximum daylight factor and illuminance values. Uniformity ratios are provided as minimum/average and minimum/maximum.
LEED v2 Credit EQ8.1 Report
A report is generated detailing eligibility for the LEED v2 daylighting credit EQ8.1 based on % area of the occupied part of the building that has better than the minimum daylight factor. The CIE overcast sky (10000 lux) sky model is used. An example LEED daylight report is shown below.