Daylighting Display Options - Right to Light
This topic covers the Daylighting display options specific to the 5-Right to light (BS8206) Simulation type.
Option
The following right to light outputs can be displayed:
Report type
The following report types are available for all Right to light outputs:
- 1-Map - a graphical display of the results is displayed.
- 2-Grid - a table of summary results for each zone or window is displayed (depending on the selected Option).
Scale
The Scale settings are available when the Report type is set to one of the map options:
Source
The scale of the daylight maps can be defined using data from the building, block or zone level or it can be entered manually. It is a way to define the minimum and maximum values on the scale. Select from one of the following options.
- 1-Building, where all of the values calculated for the whole building are scanned and the lowest and highest values are used. This allows plots to be generated using a consistent scale even when displaying data at block or zone level.
- 2-Block, where all of the values calculated for the current block are scanned and the lowest and highest values for are used. This allows plots to be generated using a consistent scale within a block even when displaying data at zone level.
- 3-Zone, where the scale is tailored to the current zone allowing in many cases a more even distribution of colours through the map. When using this option, images generated for each zone will use a different scale and so will not be so easily comparable as they would be if one of the 1-Building or 2-Block options had been used.
- 4-User defined, where you can enter the minimum and maximum values on the scale manually. This has the advantage of allowing a specific lower and upper scale value to be used. It also allows you to define colours to represent areas that exceed the maximum or are lower than the minimum. For example, for many point-in-time daylighting calculations, daylight factors lower than 2% are considered to be inadequately daylit. These areas can be highlighted in a special colour to help provide a clear visual indication of the compliant and non-compliant areas.
Value source
When Option is set to 1-Vertical sky component or 4-Average daylight factor, Value source defines whether to view Daylight factor or Illuminance results. Select from:
-
1-Daylight factor - daylight distribution maps are plotted as daylight factors. Note that in the case of VSC, the Daylight factor values are displayed as percentages with the illuminance on each window divided by the illuminance on an unshaded horizontal plane.
-
2-Illuminance - daylight distribution maps are displayed based on illuminance data.
When Option is set to 2-Annual probable sunlight hours (APSH), Value source defines whether to view results as Annual hours or Percentage annual hours. Select from:
-
1-Annual hours - windows are coloured and labelled based on the number of annual hours for which the APSH criteria are met.
-
2-Percentage annual hours - windows are coloured and labelled based on the percentage of occupied annual hours for which the APSH criteria are met. The denominator used in the % calculation is the total number of occupied hours.
Note: when Source is set to 4-User defined, Value source is hard set to 1-Annual hours.
 User-Defined Scale Settings
Low value
When using the 4-User defined Scale source you can enter the minimum scale value to be displayed. The units and meaning of this setting depend on the Value source setting, i.e. the data that is being plotted.
High value
When using the 4-User defined Scale source you can enter the maximum scale value to be displayed. The units and meaning of this setting depend on the Value source setting, i.e. the data that is being plotted.
Apply scale "too dark" colour
If you wish to set a specific colour to represent the areas of the working plane that have values below the entered Low value criterion then check this box and define the colour in the colour selector below.
Scale "too dark" colour
Select the colour to be used to represent areas of the working plane that are below the entered Low value. Typically a dark grey or black colour might be used to show areas of the working plane that are inadequately daylit.
Apply scale "too bright" colour
If you wish to set a specific colour to represent areas of the working plane that are above the entered High value then check this box and define the colour in the colour selector below.
Scale "too bright" colour
Select the colour to be used to represent areas of the working plane that are above the entered High value.
Right to Light Results
Vertical Sky Component (VSC)
VSC results can be displayed either graphically (as a map) or in grid form.
Map
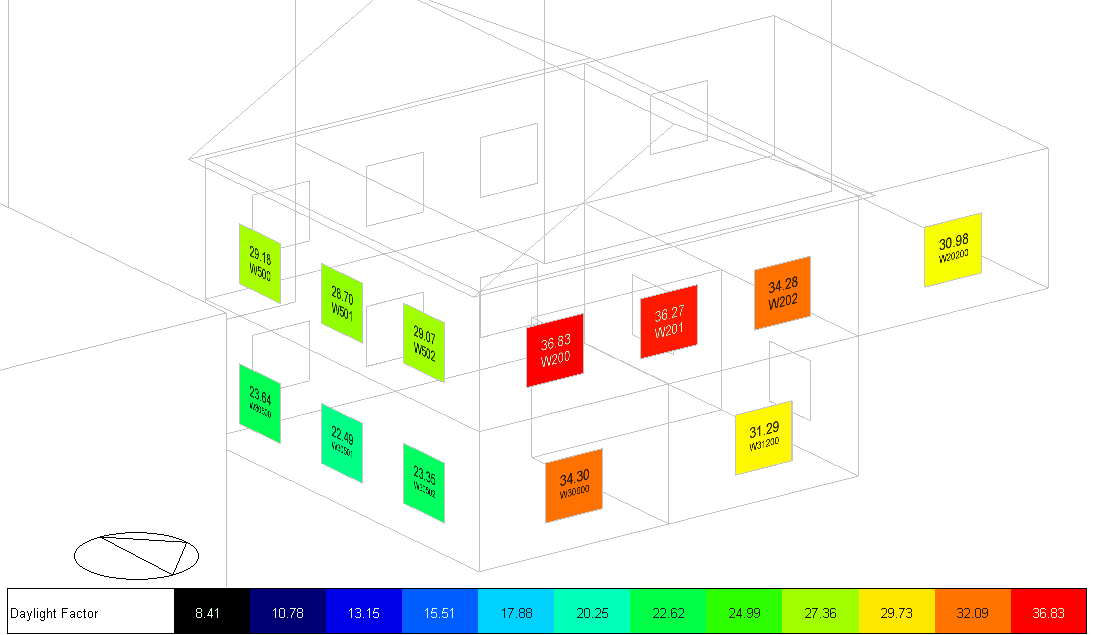
When Report type is set to 1-Map, the VSC results are displayed on the model by printing the value on each exterior window and colouring each window according to the scale.
When Value source is set to 1-Daylight factor, the VSC is displayed as a percentage:
100 x illuminance on the centre point of the outside face of the window / illuminance on an unobstructed horizontal surface.
Alternatively, when Value source is set to 2-Illuminance, the VSC is displayed as the illuminance on the centre point of the outside face of the window.
An example VSC map output is shown below.
Each window also has a unique Window ID label printed on it below the daylight factor or illuminance value. This can be used to cross reference the window when viewing the grid output, see below.
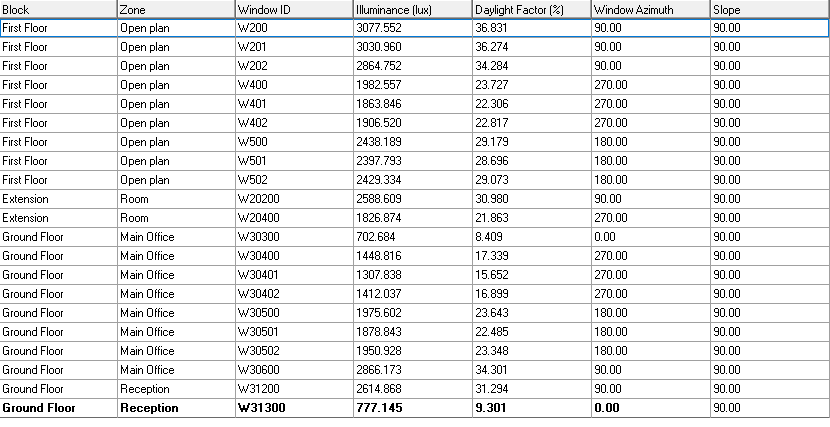
Grid
When Report type is set to 2-Grid, the VSC results are displayed in a grid, with each window on a separate line with the following data:
-
Block
-
Zone
-
Window ID can be used to cross reference with Window ID values printed on each window in the map view.
-
Illuminance (lux or fc)
-
Daylight factor - the Vertical Sky Component output calculated as described above.
-
Window Azimuth - orientation of the window expressed as degrees from North. East-facing windows have a value of 90°.
-
Window Slope - vertical windows have a slope of 90° while horizontal windows have a slope of 0°.
Annual Probable Sunlight Hours (APSH)
APSH results can be displayed either graphically (as a map) or in grid form.
Map
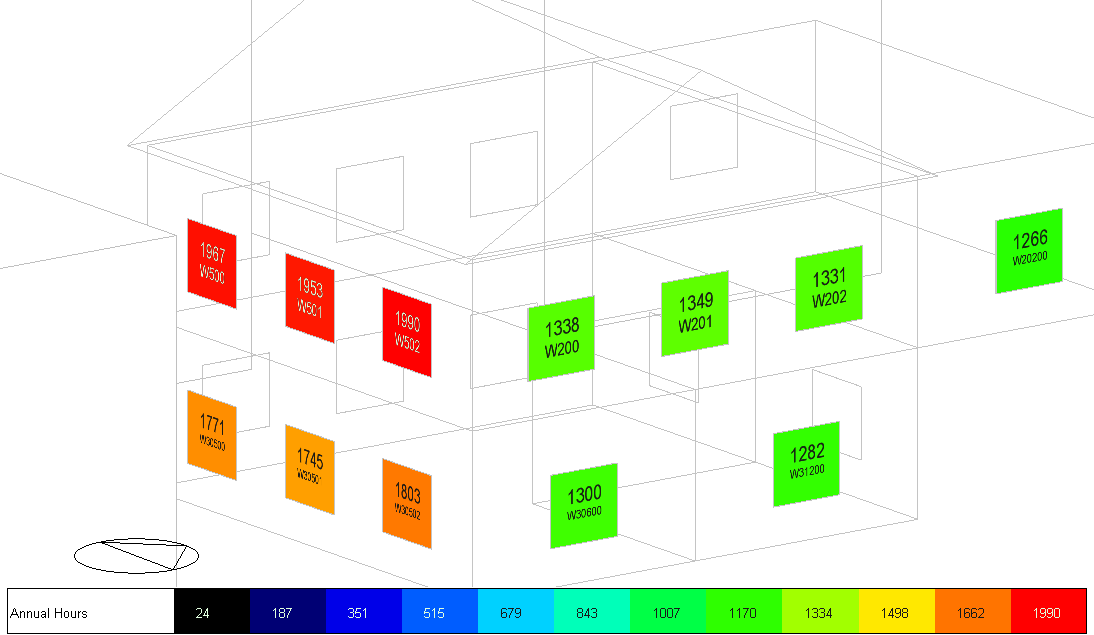
When Report type is set to 1-Map, the APSH results are displayed on the model by printing values on each exterior window and colouring each window according to the scale.
When Value source is set to 1-Annual hours, the APSH is displayed as the number of hours when direct sunlight fall on the centre point of the outside face of the window.
Alternatively, when Value source is set to 2-Percentage annual hours, the APSH is displayed as:
100 x Number of hours when direct sunlight falls on the centre point of the outside face of the window / Number of hours when the sky was clear with sun
An example APSH map output is shown below.
No Sky Line (NSL)
NSL results can be displayed either graphically (as a map) or in grid form.
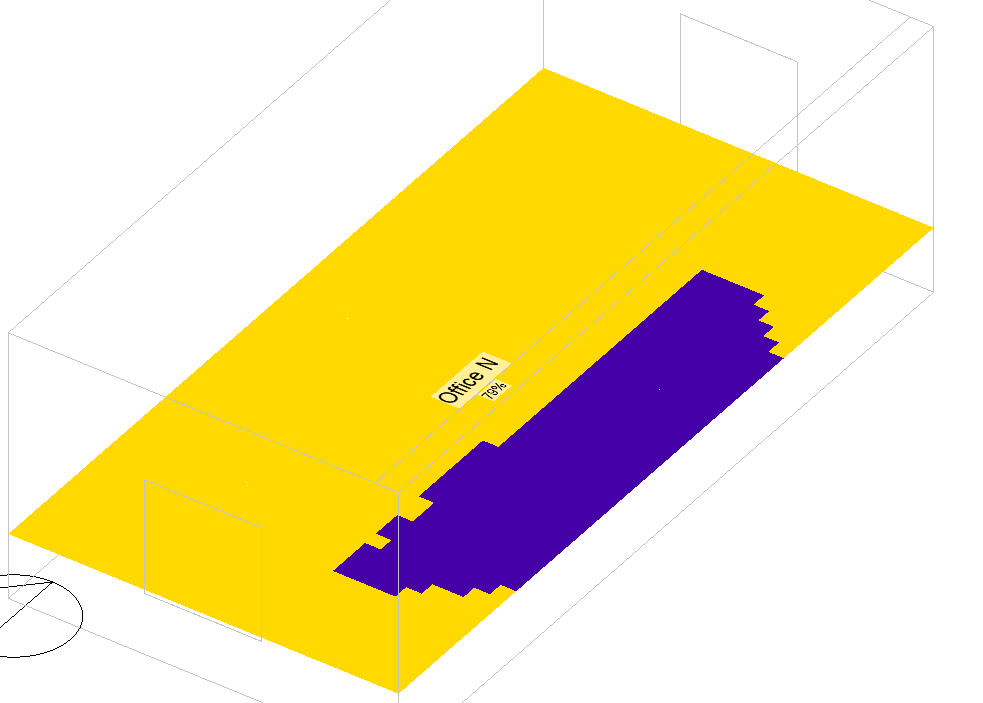
Map
When Report type is set to 1-Map, the NSL results are displayed graphically on the working plane in the model. Yellow areas indicate the parts of the working plane that have a view of the sky, while purple areas have no view of the sky.
Each zone has a label with the name of the zone and the % of the zone's working plane area where the sky is visible. See screenshot below.
Grid
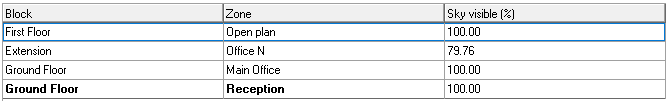
When Report type is set to 2-Grid, the NSL results for all zones are displayed in grid form with the following data:
-
Block
-
Zone
- Sky Visible %, i.e. the % of the zone's working plane area where the sky can be seen.
Average Daylight Factor (ADF)
ADF results can be displayed either graphically (as a map) or in grid form.
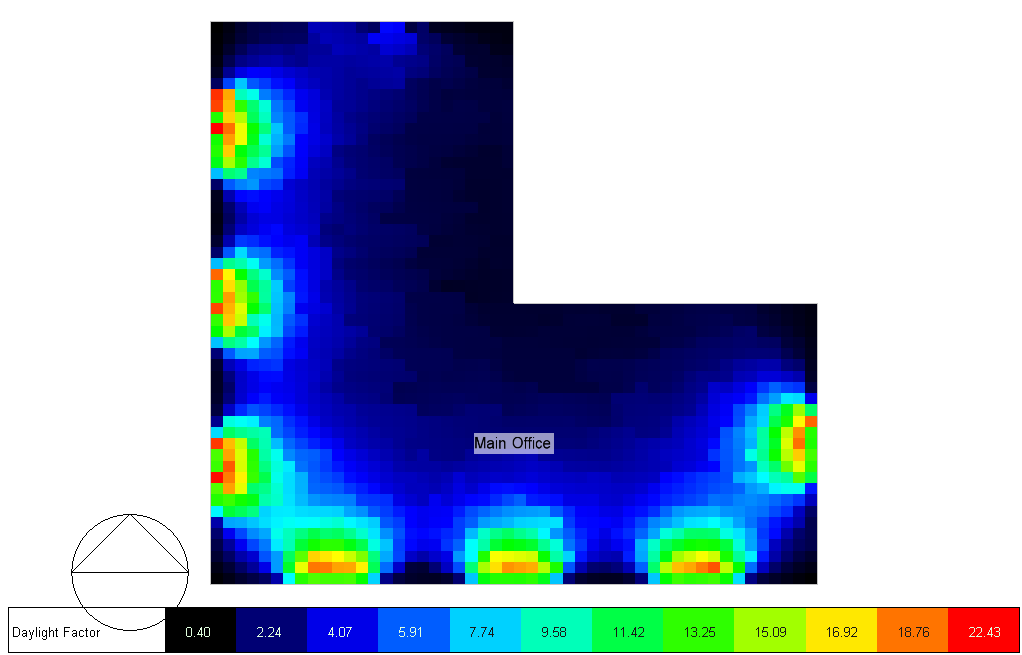
Map
When Report type is set to 1-Map, the distribution of the Daylight factors across the working plane is displayed graphically on the model. An example daylight map for a single zone is shown below.
Grid
When Report type is set to 2-Grid, the ADF results for all zones are displayed in grid form with the following data:
-
Block
-
Zone
- Floor Area (m2 or ft2)
- Average Daylight Factor (%)
- Minimum Daylight Factor (%)
- Maximum Daylight Factor (%)