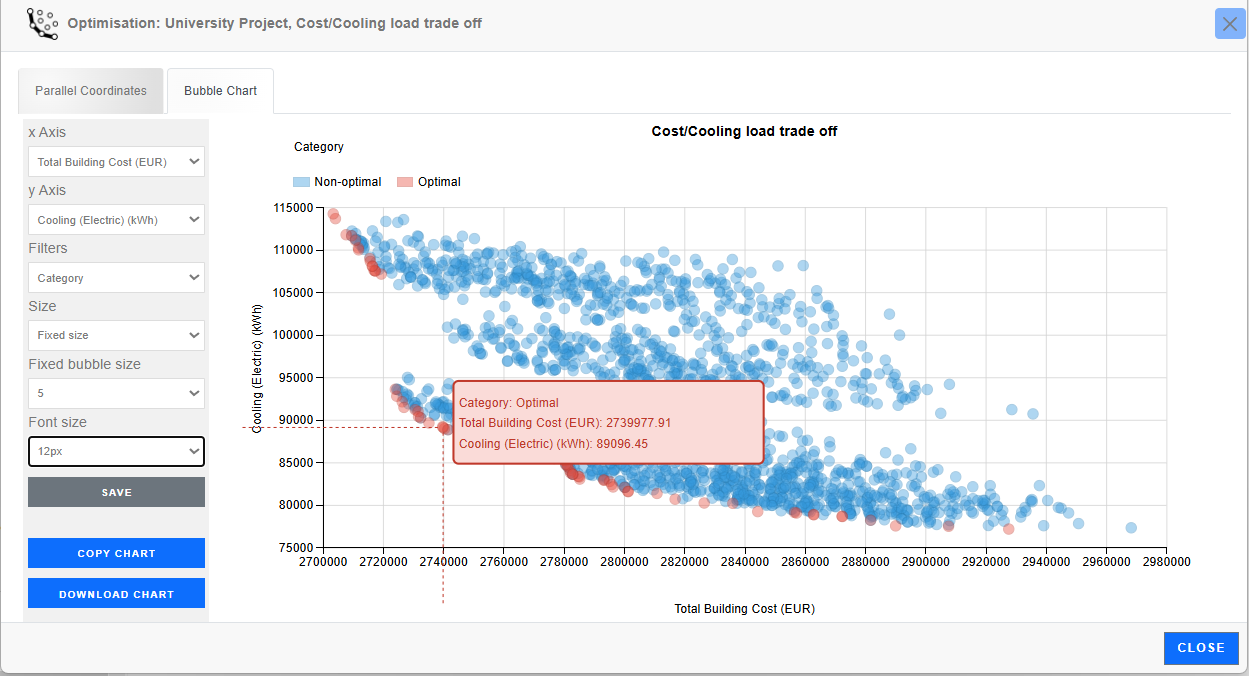
When first opening an Optimisation analysis, you will see a bubble chart similar to the one below. By default, the settings should be similar to those used in DesignBuilder, so unless changes were made to defaults on the DesignBuilder Insights Upload Options Dialog, the default Insights bubble chart should look similar to that displayed in DesignBuilder, with the same X and Y-axes, Filter and a fixed bubble size.
This shows the Pareto front of optimal solutions without any additional slicing and dicing of the data.
Moving the mouse over a data point provides a tooltip showing the X and Y-axis values and the Category which, in the above case, defines whether the point is Optimal or Non-optimal. The tooltip is displayed in the same colour as that used to define the category.
The panel on the left-hand side of the screen allows changes to be made to a range of settings:
Select an Objective, Constraint, Additional output, or a numeric Design variable from the drop list to be used as the X-axis variable. List type variables are not available for selection. For optimisation bubble charts, an objective should normally be selected here.
Select an Objective, Constraint, Additional output, or a numeric Design variable from the drop list to be used as the Y-axis variable. List type variables are not available for selection. For optimisation bubble charts, an objective should normally be selected here.
Select "Category" or a non-numeric List type variable from the list. The Filter setting is used to create a legend and to colour the bubbles. For example, the default "Category" filter colours each point either red or blue depending on whether it is Optimal or Non-optimal.
By clicking on the coloured box in the legend, it's possible to hide data points of one or categories. For example, to hide all non-optimal points, click on the blue "Non-optimal" legend box. The blue box is faded and the corresponding non-optimal points on the bubble plot are hidden. See below:
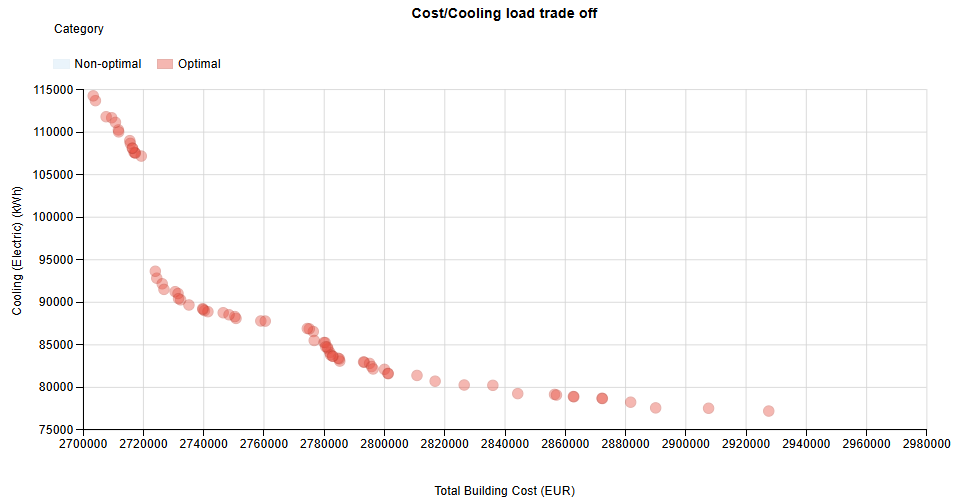
To display the non-optimal values again, click again on the "Non-optimal" points box in the legend.
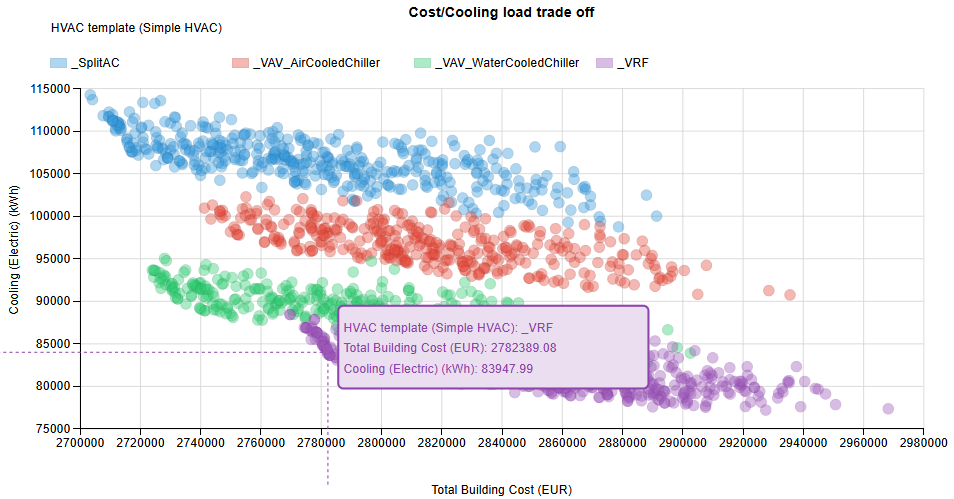
Alternatively, select a list type variable from the filters list to colour each data point based on the setting for the selected variable. In the example below, the "HVAC template" was selected as the Filter. The result is that each data point is coloured based on its HVAC template.
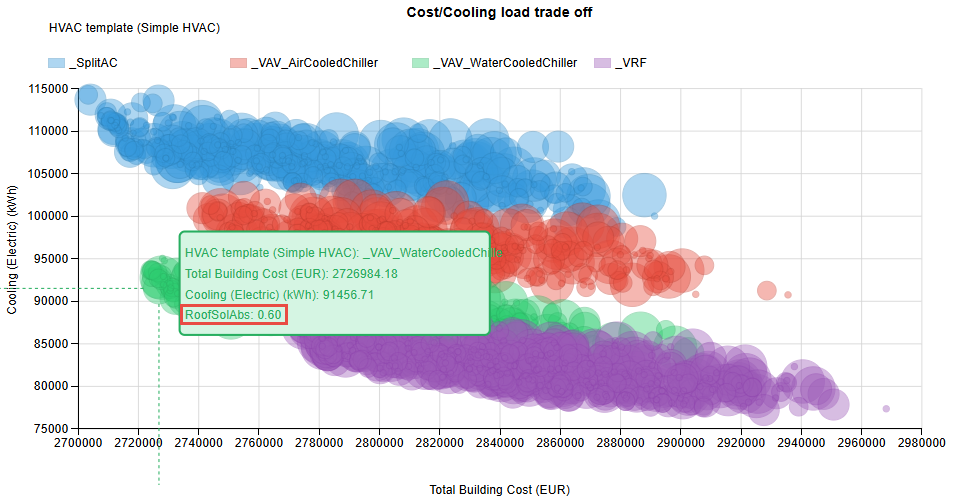
In addition to the Fixed Size option, you can also use the Size drop list to select an Objective, Constraint, Additional output or numeric Design variable to define the size of each bubble. In the example below, the roof solar absorptivity is used to define the bubble size.
When using the Fixed size Size option, you can define the size of all bubbles by selecting a value from the Fixed bubble size drop list.
When Size set to anything other than Fixed size, you can define the minimum size for bubbles by selecting a value from the Min bubble size drop list. This minimum size corresponds to the minimum value for the selected objective, constraint, extra output or numeric variable.
When Size set to anything other than Fixed size, you can define the maximum size for bubbles by selecting a value from the Max bubble size drop list. This maximum size corresponds to the maximum value for the selected objective, constraint, extra output or numeric variable.
Select the font size to be used for all legends, axis values, x and y-axis labels, and categories.
At the bottom of the left-hand panel, you can also find buttons to save settings and copy/download the chart.
These are described in more detail below.
Pressing the Save button, the current set of options described above are stored, so when viewing the chart next time, it will look exactly as it does now.
Saving these settings only applies to the current chart and does not effect on any other analyses or charts.
Pressing the Copy chart button copies the currently displayed bubble chart onto the clipboard ready for pasting into an external document.
Pressing the Download chart button causes the currently displayed bubble chart to be downloaded as a png file into the Downloads folder on your local machine. The file is named using the analysis Name.