To export a set of existing parametric results to Insights, follow the steps below.
1. Open your model, go to the Simulation screen. To export optimisation or UA/SA results go to the Optimisation + UA/SA tab. Or, to export parametric analysis results go to the Parametric tab.
2. Check the graphical results are displayed.
3. Click on the Export data toolbar icon ![]() .
.
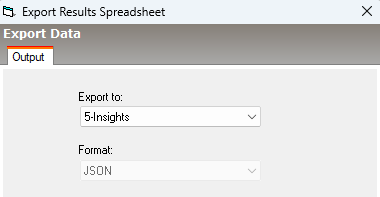
4. On the Export Data dialog, select the 5-Insights "Export to" option. The Format will be automatically set to JSON:
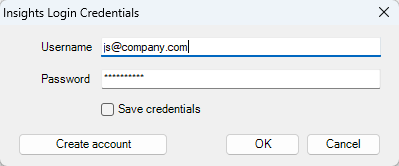
5. When you press OK on the Export Data dialog, the Insights Login Credentials dialog is displayed:
6. If you have already registered on the Analytics portal, enter your email address and password.
Check the Save credentials checkbox to avoid having to re-enter these settings for every export. Or, if you share your machine with others, you may prefer to leave it unchecked.
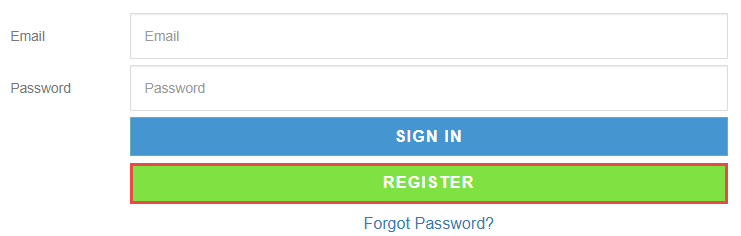
7. If you don't already have an account on the Analytics portal, click on the Create account button. This will take you to the main login page of the Analytics portal where you can click on the Register button. See below.
Once you have registered you can enter your email address and password on the Insights Login Credentials dialog.
For more details on registration see Insights Preparation
8. Having entered your account credentials, press the OK button to close the credentials dialog and open the Insights Upload Options dialog. Here you can enter details on the analysis and add your parametric results to an existing Insights project or to a new project that you create from this dialog. Details on how to use this dialog are provided in the next section.
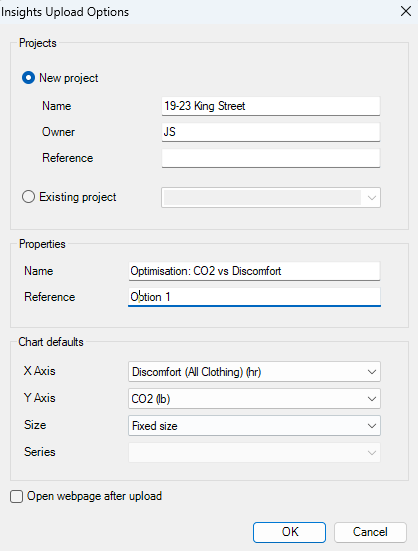
Insights allows you to store your parametric results within projects that you define. To create a new project, select the New Project radio button and enter the details of the new project, including the Project Name, the Owner of the project and a Reference. You can use these fields to provide any additional information associated with the data.
Alternatively, you can store your results with an existing project, defined when uploading a previous parametric data set. In this case, check the Existing project radio button and enter the Owner and Reference fields as described above.
Under the Properties header, you can enter a Name for this data set. This will be used as the main identifier for the data and as a header for graphs and diagrams when they are displayed. You can also enter Reference text.
Note: All Reference and Owner fields on this dialog are for your reference only and can be left blank if this data is not required.
Tip: All Name, Reference and Owner data you enter here can be edited later on the Insights website, if necessary.
Under the Chart defaults header, you can select the default X-Axis and the default Y-Axis to be used when plotting results on bubble and line plots.
You can also select how the Size of bubbles are defined by default for bubble charts if displayed in Insights. If you wish X-Y data points to have a fixed size then keep the default Fixed size setting.
When exporting parametric analysis data, you can also select a variable as the default Series. This will be used to create one or more lines on the parametric line plot each with a constant variable value. The range of series variable values will be displayed in the legend of the line plot. For example, if you select the series to be "Glazing type", the parametric analysis results will be displayed with a set of lines of different colours, one line for each glazing type option. The line colours are mapped to glazing type options in the legend.
These settings can all be changed later within Insights.
Check the Open webpage after upload checkbox to gain quick access to the Insights website directly from DesignBuilder.
Press OK to upload the data to Insights.