The usual way to view Insights data is from a Project's Analyses list. Having signed in, click on a Project to list its Analyses and then click on the analysis row of interest. The parametric data for that analysis will be displayed.
Depending on whether the data selected is for an Optimisation, a Sensitivity Analysis, or a Parametric Analysis, you will be able to access different results:
Optimisation and UA/SA analyses provide Bubble Charts and Parallel Coordinate Plots.
Parametric Analysis analyses provide Line Charts and Parallel Coordinate Plots.
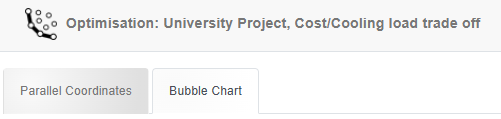
Click on one of the tabs at the top of the screen to select the required output. For example, for Optimisation analyses, the header and tabs are configured as shown below.
For more information on how to use the available Insights chart types, see the topics below: