Example - CFD External Analysis

This CFD example will go through the steps required for a typical external CFD analysis:


External analyses are simpler than internal analyses in that you do not need to define any internal boundary conditions. Also they are isothermal and take account principally of only velocity and pressure.


It is possible to edit the grid and select monitor cells with external CFD as well as with internal CFD.

Creating the Model

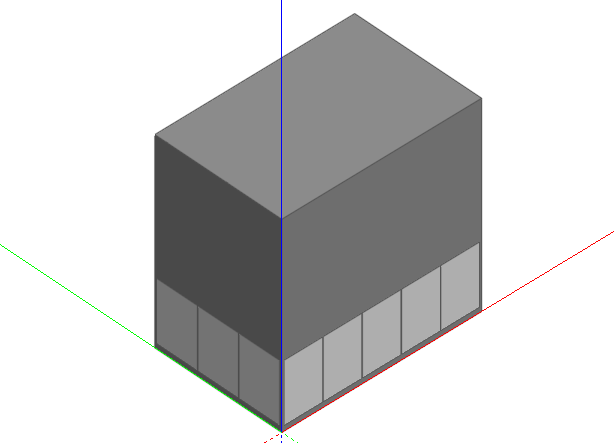
The model comprises a simple rectangular block with dimensions 30.0m x 20.0m x 30.0m.


Click on the Add new block tool and change the Block type to Building block and the Height to 30.0m. To place the origin of the building at the site origin, type in 0 0 and press the <Return> key. To then create the block with a 30.0m x 20.0m perimeter, type in 30 20 and press the <Return> key. A block will be created with the required dimensions. Alternatively create the block by drawing the base perimeter in the normal way.


Creating a New CFD External Analysis

Each DesignBuilder project can have one or more CFD analyses. Each CFD Analysis can be a different set of results for a different variation on the model. Unlike simulation data, CFD Analyses are not deleted automatically when the model is modified on the Edit screen.

  1. Click on the site in the navigator to move to the site level.

    External CFD analyses can only be conducted at the site level.
  2. Click on the CFD tab to set up an external CFD analysis.
  3. After clicking on the CFD tab, the New CFD analysis dialog is displayed. Enter Wind analysis in the Name field and leave the grid spacing and grid line merge tolerance in their default settings.
  4. Default grid spacing and grid line merge tolerance settings are covered later.
  5. Under the Wind header, change the free-stream velocity to 12.0m/s, the Direction to 45° and the Exposure to Urban.  The wind direction is defined clockwise from North, so the default of 270° represents a westerly and a setting of 45° a North‑easterly.
  6. The Site Domain Factors are multipliers that are applied to the overall model extent in the X (length), Y (width) and Z (height) dimensions to derive a site domain across which the calculations will be carried out. Keep the defaults of 3, 3 and 2.
  7. After clicking on OK to create the analysis data set, the CFD screen displays the model in wire-frame together with the site domain, which is outlined in dotted lines.


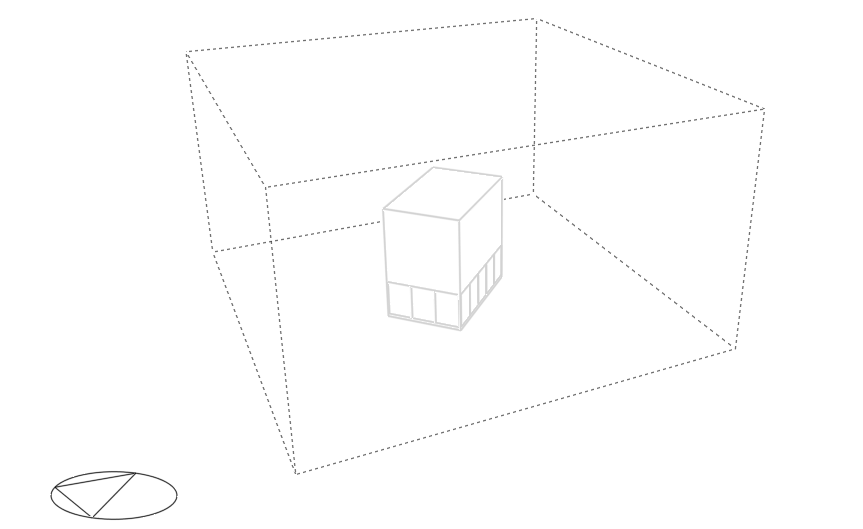
Notice the rotation of the domain with respect to the building to account for the wind direction.

Setting Up Monitor Cells

It is usually a good idea to display the state of one or more monitor cells in the domain so that you can ‘monitor’ the extent to which the calculations have settled down to a final converged solution. DesignBuilder automatically sets up a single monitor cell at the centre of the domain. You can add new monitor points at any time as follows.

Click on the Define CFD monitor points tool and select the Z grid axis using the grid axis selector tool. Move the cursor along the axis to select a plane a couple of grid cells above the building and then move the cursor across the selected plane and select a cell roughly above the centre of the building. The Cell monitor data panel is displayed at the bottom left of the screen. Enter the name Roof into the Monitor location name field and click on the green tick Apply changes button.


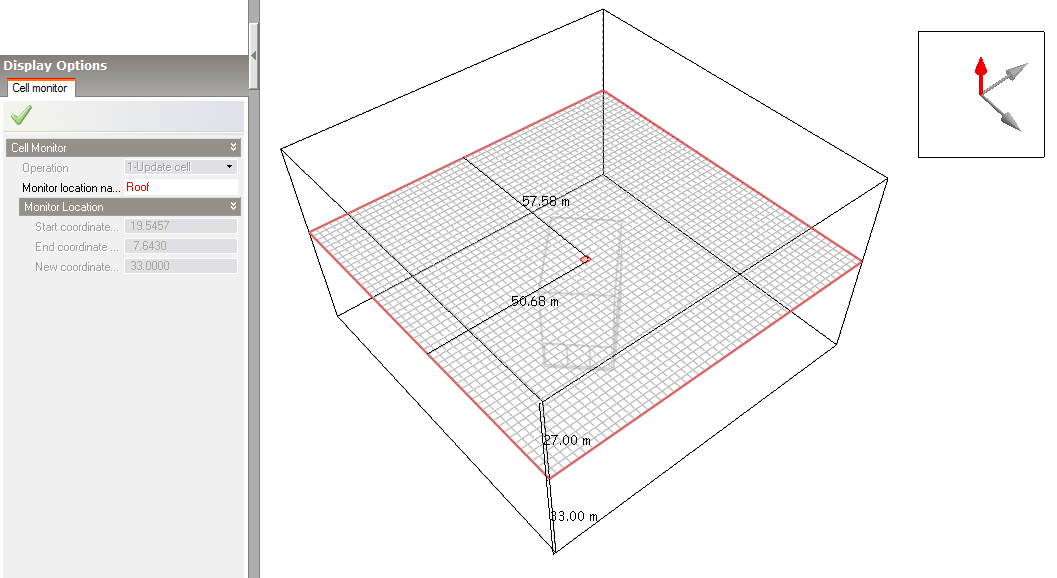
Press <Esc> to cancel the Define CFD monitor points tool.

Running the CFD Calculations

To set up calculation data and run the CFD calculations, click on the Update calculated data button, which will bring up the CFD Calculation options dialog. The left hand side of the calculation dialog contains various calculation options.


Keep the default options except for Iterations which should be set to 5000 and under the Residual Display header, switch on the X, Y and Z-axis velocity residuals.


Click on the Start button to begin the calculations. Wait until the calculation is fully converged when the residuals have reached the specified minimum and the “Finished (Converged)” indicator is displayed at the bottom left of the dialog. Notice that the displayed velocity for the supply monitor point becomes constant.


Press the Cancel button to close the calculation dialog.

Displaying CFD Results

  1. Go to the Display Options panel and open the Velocity header under the Variable Settings header and set the Vector scale factor to 2.0 and the Maximum vector length to 5m.


  1. Under the Slice Settings header, make sure that only Velocity vectors is switched on.


  1. Click on the green tick Apply changes button.


  1. Click on the Select CFD slice tool. Use the grid axis selector to change the current axis to the Z-axis and then move the mouse across one of the side surfaces of the site domain along the Z-axis until the slice selection frame is located 25m above the ground plane. Click on the mouse to add the currently selected slice to the display.


  1. Clear the current slice from the display using the Clear all slices tool.
  2. Switch off Velocity vectors under the Slice Settings header on the Display Options panel and switch on the Velocity contours and Filled Velocity contours.
  3. Click on the green tick Apply changes button. 
  4. Select the Y-axis from the grid axis selector and move the cursor over the top surface of the site domain along the Y-axis until the slice selection frame is 50.68m from the origin and click the mouse to add the slice to the display.
  5. To add a horizontal slice 5m from the ground, select the Z-axis from the grid axis selector and move the cursor over one of the side surfaces of the site domain along the Z-axis until the slice selection frame is 5.0m above the ground plane and click the mouse to add the slice to the display.


Display 3-D Contours

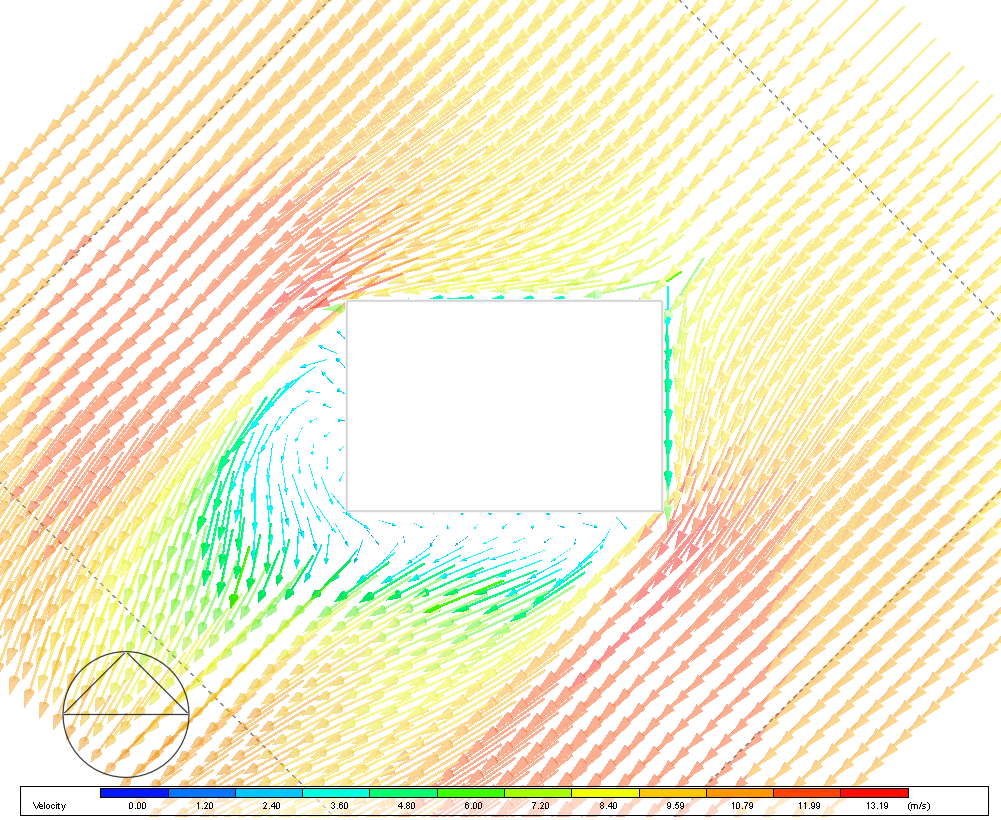
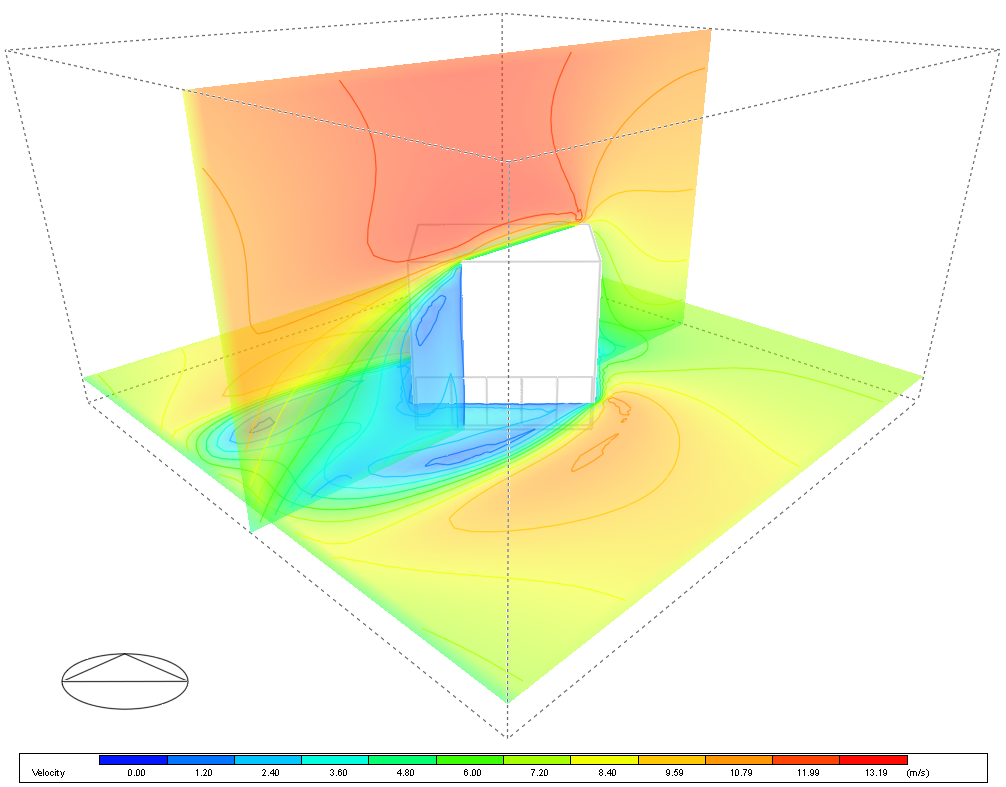
3-D contours can be displayed to show the values of a variable throughout the domain. 3-D contours can display a lot of data:

  1. Clear the current slice from the display using the Tools > Clear all slices menu option.
  2. Under the 3-D Contours header on the Display Options data panel, switch on Pressure. Click on the green tick Apply changes button.