toolbar icon or from the Tools top menu option.
The Options dialog can be accessed either from the toolbar icon or from the Tools top menu option.
Select this option if you would like the session to be saved automatically when closing the Results Viewer.
If you would like Results Viewer to offer to save a drs session file when exiting then check this option.
The zoom level of the html Summary data can be controlled with this setting.
Set the language to be used in the Results Viewer user interface. Options are:
English - default
Italian
Spanish
French
Portuguese - not maintained so will be the same as English.
German
You must close Results Viewer down and re-open it to see any changes made to the language option.
Note: This setting only controls the language used for dialog labels, menus and options. It does not affect the language used for the names of the Reports or the Areas displayed on the Reports grid and graphs.
When a report is only generated for certain periods in the simulation, e.g. when the simulation Reporting period option is set to 3-User-defined schedule, the name of the schedule used to control the times that data for each report is generated can optionally be displayed in the Schedule column in the Reports grid. This setting controls the display behaviour of the Schedule column. The available options are:
Show - the Schedule column is displayed.
Hide - the Schedule column is not displayed.
Auto - the Schedule column is displayed only if one or more reports in the current dataset use a schedule to control the output of the data. This is the default option.
The settings on the Units tab allow you to control the way that data is displayed on the screen, in particular whether SI or IP units are to be used and the units to be used energy and power data. The screenshot below illustrates the various settings that are available on the Units tab.
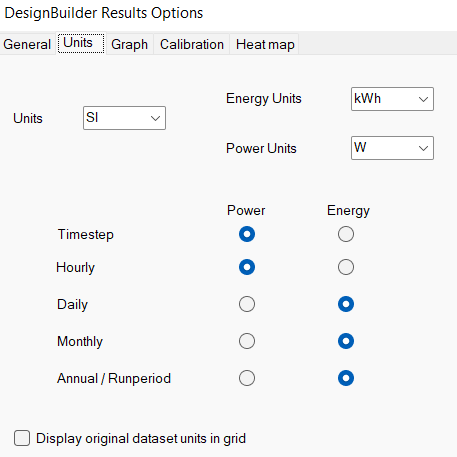
Use the Units drop list to define whether results are to be displayed in SI or IP units.
EnergyPlus natively provides energy outputs in J, however this is rarely a convenient unit to work with when analysing building performance results. The Energy units drop list allows you to define the units that Results Viewer will use to display all such Energy reports. The available options are:
kWh (default)
MWh
Wh
J
kJ
MJ
GJ
Btu
kBtu
MBtu
EnergyPlus natively provides power outputs in W, however this is not always a convenient unit to work with when analysing building performance results. The Power units drop list allows you to define the units that Results Viewer will use to display all such Power reports. The available options are:
W (default)
kW
MW
Btu/h
kBtu/h
MBtu/h
You can define whether energy and power data should be displayed as either power or energy for each interval by checking radio buttons in the grid as appropriate.
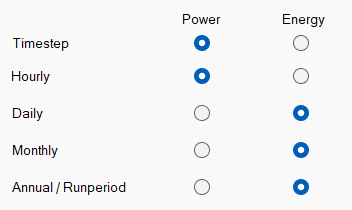
For example if the eso file generated by the simulation includes hourly energy reports which use energy (J) as the units, it will usually by much more convenient to view such results as power (e.g. W or Btu/h). In which case you should check the Hourly / Power radio button in the grid (it is checked by default).
On the other hand if the eso file you have generated includes monthly energy reports which use power (W) as the units, it will usually by much more convenient to view such results as energy (e.g. MJ, kWh or Btu). In this case you should check the Monthly /Energy radio button in the grid (it is checked by default).
By default all energy and power reports are displayed as power at hourly and timestep intervals and as energy at longer intervals.
Check this option if you would like to see the units originally used in the EnergyPlus results in the Reports grid. In this case an additional Source Units column is displayed alongside the standard Units column. The source units are most likely to be different from the standard display units for energy and power reports and for most reports when displaying results in IP units.
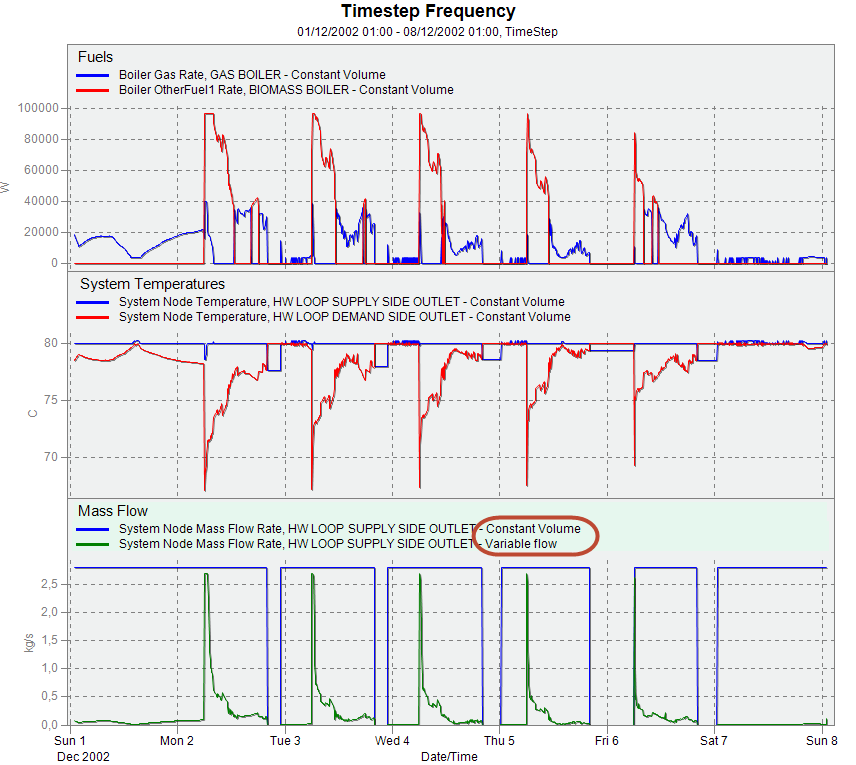
Selecting this option causes the title of each graph to be displayed for each graph as shown in highlighted areas in the graph below.

To change the name of the current graph right-click on the graph and from the DesignBuilder Options, select the Rename graph title option. Enter the title for the graph in the dialog and press OK.
When this option is checked Results Viewer displays the day of week (Monday, Tuesday ... etc) as well as the day of the month.
If you have more than one data set loaded then you should usually select this option to ensure that the data set name is included in the legend. This can help when comparing results for different simulations.
The output above shows how the dataset name is added to each legend.
When the Crosshair function is enabled you can choose whether to display interpolated values or not.
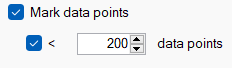
Check this setting if you would like a dot to be displayed to represent each data value. The option provides a further level of control by allowing a threshold to be set. When there are more time points on the graph that this value the dots are suppressed.
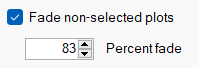
When this option is selected any plots (lines) that are not selected are displayed with a degree of transparency which can be set in the control below as a Percent fade value.
To "unfade" the non-selected plots click on the graph area to unselect all plots.
If you include the dataset name in the legend then do you want the folder name included too? If so check this option. This option is only usually used when the result sets are stored in files with the same name but in different folders.
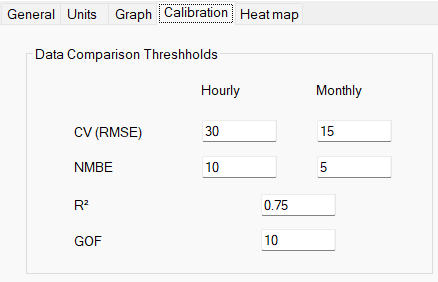
On the Calibration tab you can set the thresholds used to define whether a calibration result is considered to be within the acceptable range or not when displayed on the Data Comparison panel. Values that are within range are displayed in green and out of range values in red.
The default values for CV (RMSE) and NMBE are those recommended by ASHRAE.
The screenshot below illustrates the options that are available.
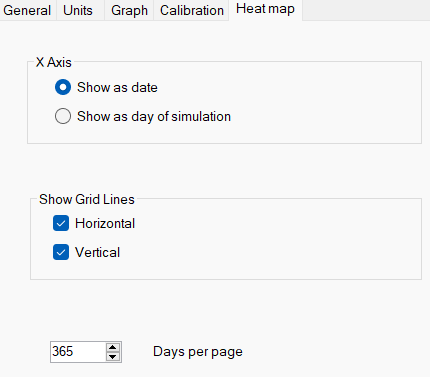
The settings the Heat map tab allow you to configure the appearance of the display on the Hourly heat map tab. The following settings are available.
Define whether X-axis labels are to be displayed as dates or "day of simulation".
Display/hide horizontal and vertical grid lines.
Set the number of days to be displayed at a time on a page. By default 365 days are displayed to allow data for a full year to be seen at once.
The screenshot below illustrates the various options that are available.