DesignBuilder can automatically run multiple simulations automatically adjusting up to 2 variables to create design curve outputs. Design curves can be very useful as part of the design process to understand how building performance is affected by variations in the building configuration and operation. DesignBuilder allows you to generate curves to show how performance parameters like energy use, cost and comfort vary as key elements of the building design are adjusted. Up to 2 design variables can be selected. For example you might want to plot the cooling demand for the base design with a range of window to wall % and glazing types variations. The design variables to be used can be selected on the Variables tab of the Parametric, Optimisation and UA/SA Analysis Settings dialog.
Click on the Parametric tab on the Simulation screen to view parametric results and carry out any simulations required.
The design curves are generated by automatically running multiple simulations of copies of the base design (i.e. the model defined on the edit screen) with the design variations applied.
Note: It is necessary to run the base simulation with monthly/annual outputs before opening the Parametric tab. The parametric simulations will all be run using the base calculation and model options. The simulation period and all other options used in the parametric analysis is the same as that defined on the Simulation calculation options dialog.
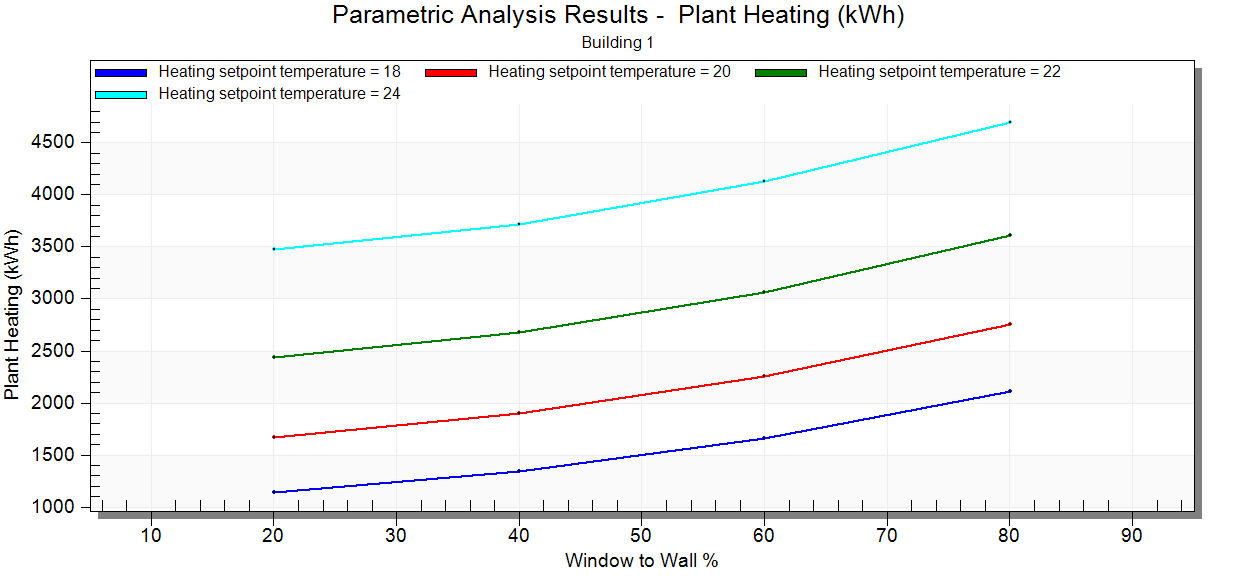
How many simulations are required? The number of design variants that are tested for 2 variable tests is the number of variants for the first variable multiplied by the number for the second variable. The variations in the example below would be different combinations of Heating setpoint temperature and Window to wall %. In all, 6 x 5 = 30 simulations would be required to generate the design curves in this example.
Impact of varying WWR and Heating setpoint temperature on Annual heating load.
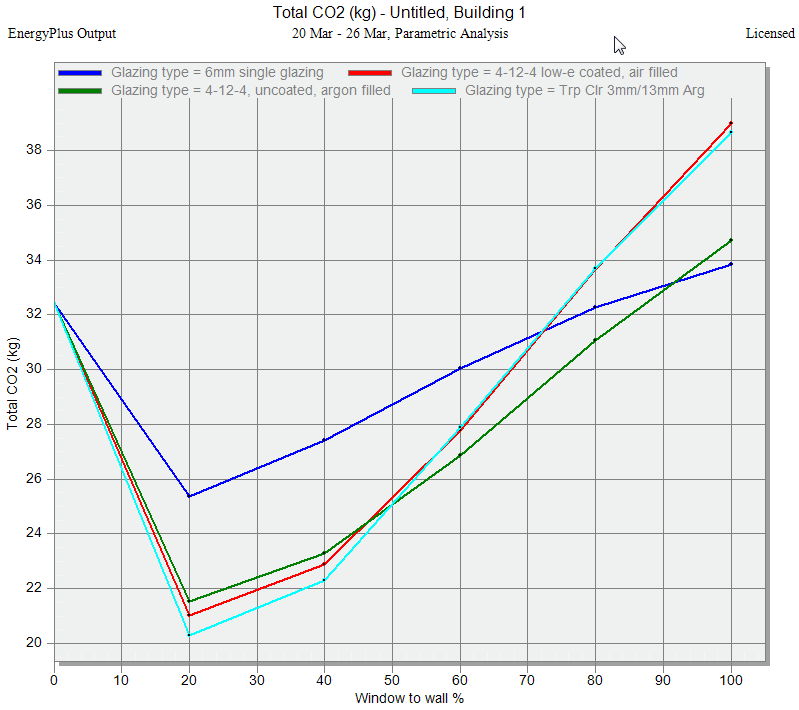
The image above shows a parametric analysis of total annual carbon emissions where glazing percentage is varied for 4 different glazing types. The building has lighting control, heating and cooling and results illustrate how in some cases optimum configurations can be identified using the parametric analysis approach.
Typical applications for parametric simulation are: