This tutorial provides a worked example to help you quickly get up to speed with using the Insights web app to analyse parametric analysis results. It uses the Parametric Analysis Basic Tutorial as a starting point.
Start by working through the Parametric Analysis Basic Tutorial, which walks you through the essentials of setting up and running a parametric analysis and analysing results in DesignBuilder.
Step 2.a - If you haven't already registered to create an account on the Insights website, go ahead and do that now. See Insights Preparation for details on this. You'll need to enter your account credentials to export results to Insights and subsequently access the website itself.
Step 2.b - Next, click on the Export data toolbar icon ![]() to start the export process.
to start the export process.
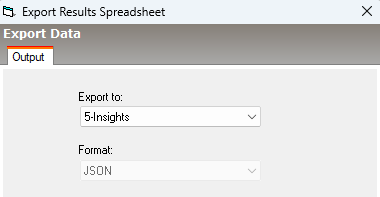
On the Export Data dialog, select the 5-Insights "Export to" option. The Format will be automatically set to JSON:
Step 2.c - When you press OK on the Export Data dialog, DesignBuilder's Insights Login Credentials dialog is displayed. Enter your email address and password and press OK to continue.
Step 2.d On the Insights Upload Options dialog you can upload your parametric results to Insights.
a. Start by selecting the New project radio button to create a new project for this tutorial.
b. Enter a name for the project: "Insights Parametric Analysis Tutorials".
c. Enter a name for the analysis: "Basic Tutorial".
Leave the other settings in their default state.
The dialog should now look something like this:
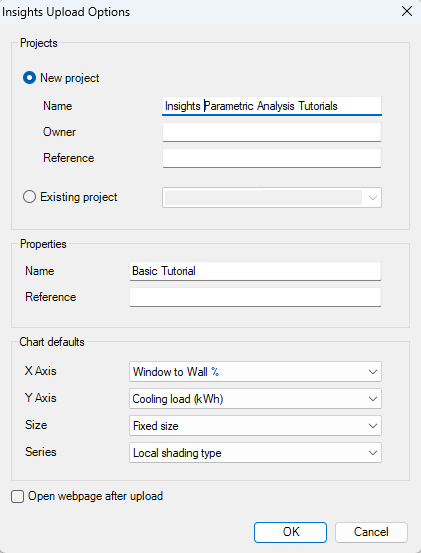
Press OK to confirm.
More details on the process involved with exporting results to Insights can be found at: Exporting Parametric Results to Insights
3.a - In your web browser, navigate to: analytics.designbuilder.co.uk
3.b - Sign in using your login credentials.
3.c - Click on the large Insights button.
3.d - You should see the "Insights Parametric Analysis Tutorial" project listed on the projects page:
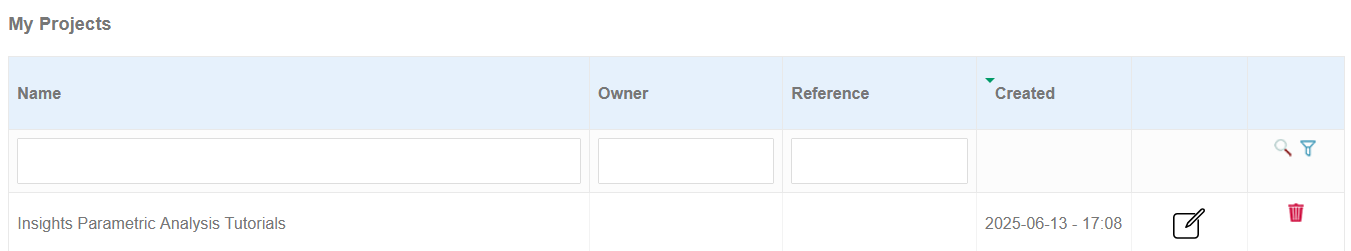
Click on this project to open it to display the list of analyses associated with it.
3.e - You should see the "Basic Tutorial" Analysis listed:
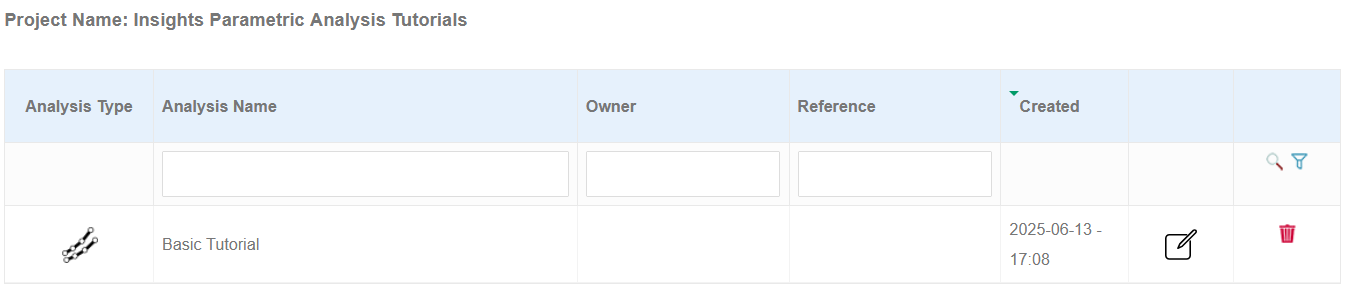
Click on the "Basic Tutorial" Analysis to display results.
You should see a graph similar to the one below:
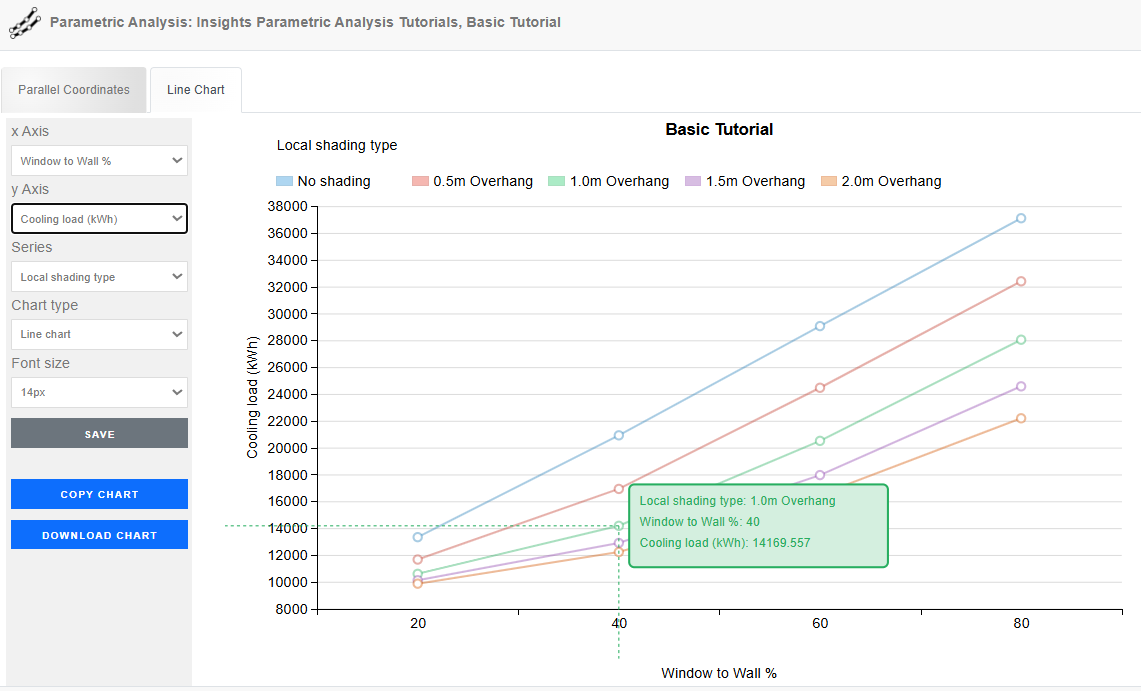
Now explore the results:
Select the "Heating load" as the Y-axis KPI.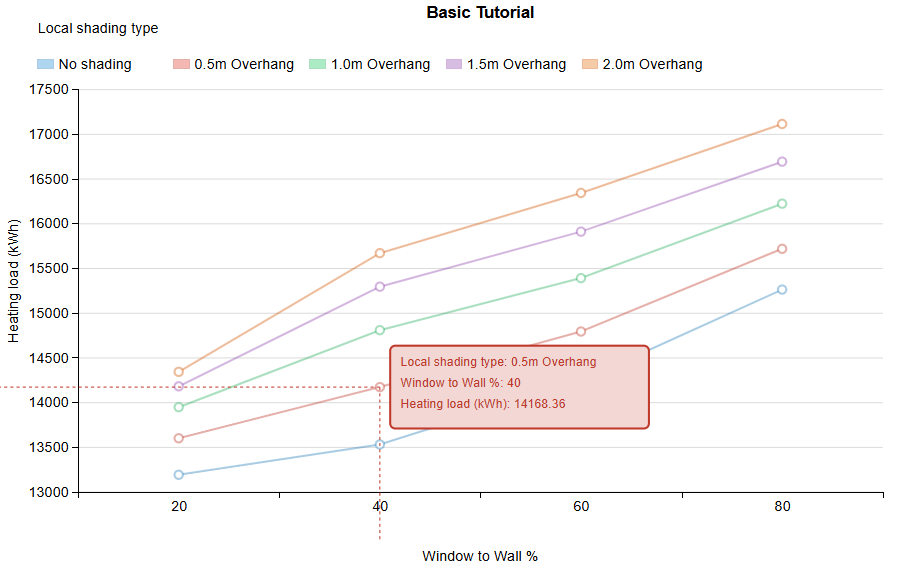
Try removing one or more of the series. For example, if you don't need to include the "2.0m Overhang" series option on the outputs, click on the corresponding legend box to remove its data.
Try different Chart types:
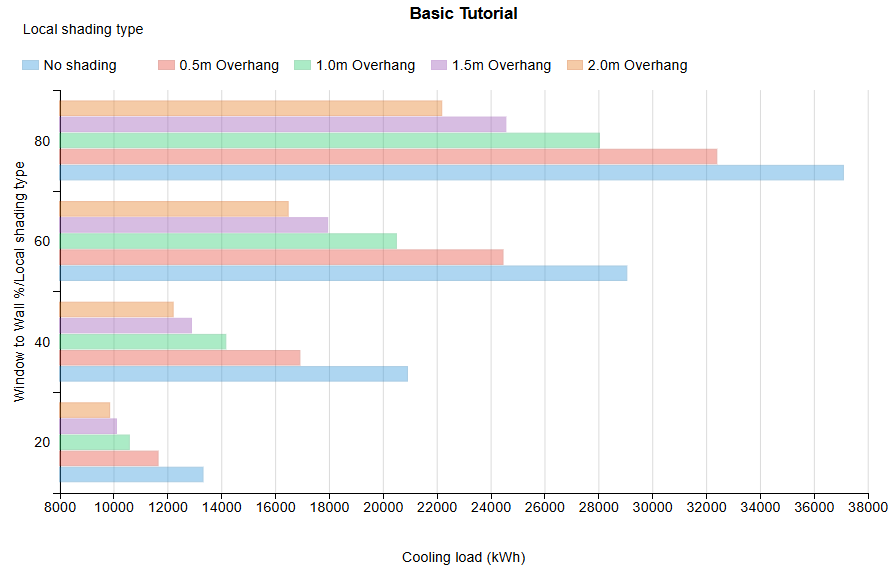
Set the Chart type to Bar chart: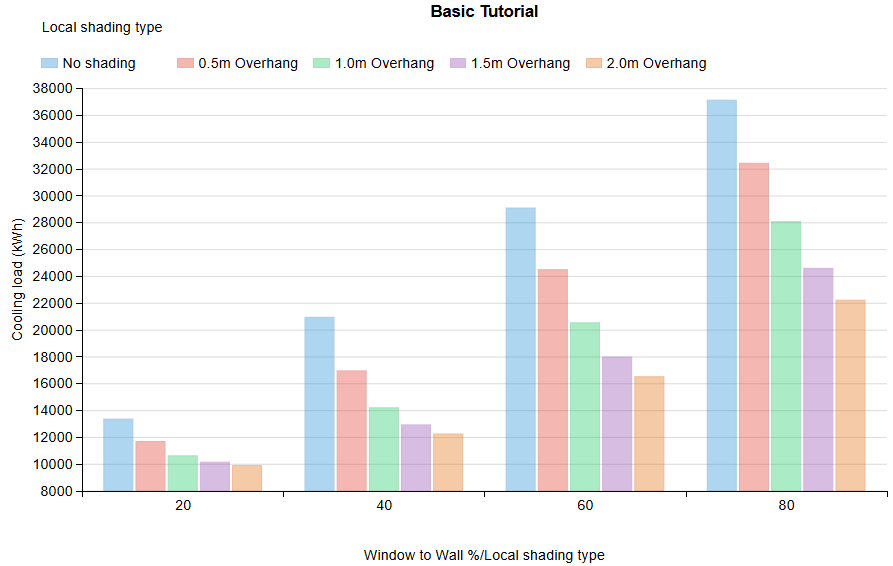
Try switching the axes by setting the x-axis to be "Heating load" and the y-axis to be "Window to Wall %":
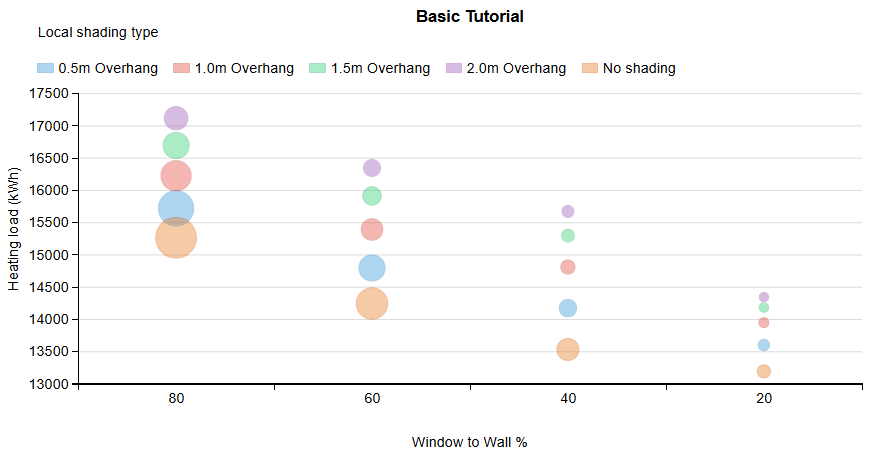
Bubble chart showing "Heating load" as the y-axis and "Cooling load" used to set the Size of the bubble.
Experiment with various Font size settings to see which works best for your outputs. Larger font sizes are often more appropriate when generating outputs for reports, for example.
Try using the Copy Chart and Download Chart buttons.
Use the Save button to save your preferred settings for your next Insights session.