The Summary tab on the Cooling design screen shows a summary of maximum loads with some display options.
You can sum total loads in 2 different ways
Summary results can be displayed either for the time and month of the overall maximum building cooling load or for the individual zone.
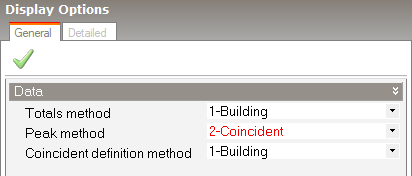
When the Peak method is set to 2-Coincident you can specify whether the coincident time is calculated for the building as a whole, i.e. for all zones, or whether it is calculated separately for each system. Select from:
1-Building, where the time of peak cooling for zones is calculated by summing hourly totals for all zones in the building, or,
2-System, where the time of peak cooling for zones is defined considering all zones in each system.
The Summary tab shows a range of design cooling loads, flow rates internal and fabric gains for each zone and other related data. Outputs for each zone are summed based on the Totals method Display options described above:
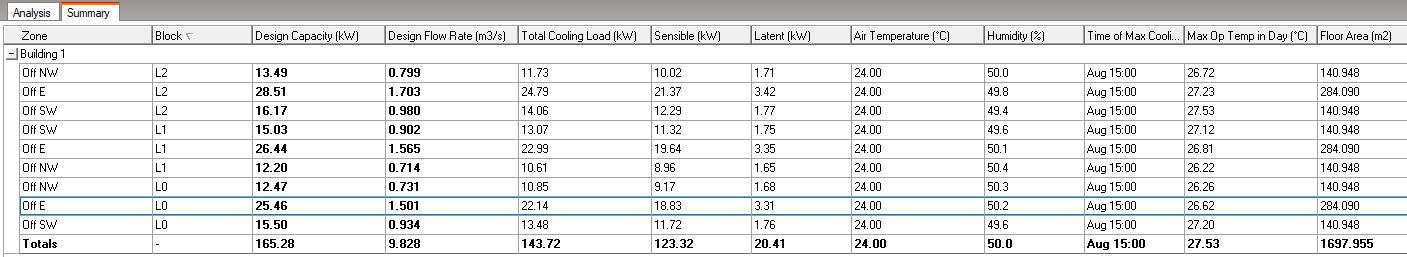
The image below shows an example of the summary results grid data when the Totals method is set to 1-Building. Note the totals and averages listed for the whole building at the bottom of the grid.
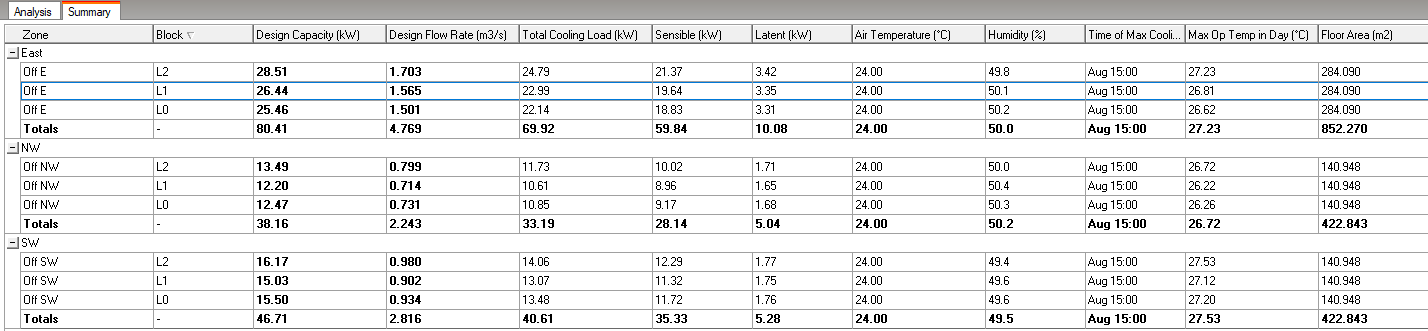
The image below shows an example of the summary results grid data when the Totals method is set to 2-System. Note the totals and averages listed for each system.
Tip: Use the File > Export > Export HVAC loads report command to view results in an industry standard PDF format. Alternatively, use the Export command to export summary data to spreadsheet format.
It might be expected that the sum of the Glazing + Wall + Floor + Roof/Ceiling + Ventilation + Infiltration + Equipment + Lighting + People + Solar gains at design conditions would equal the Sensible cooling load. However, it is unrealistic to expect the sum of a mix of convective and radiant gains to equal the (purely convective) cooling load.
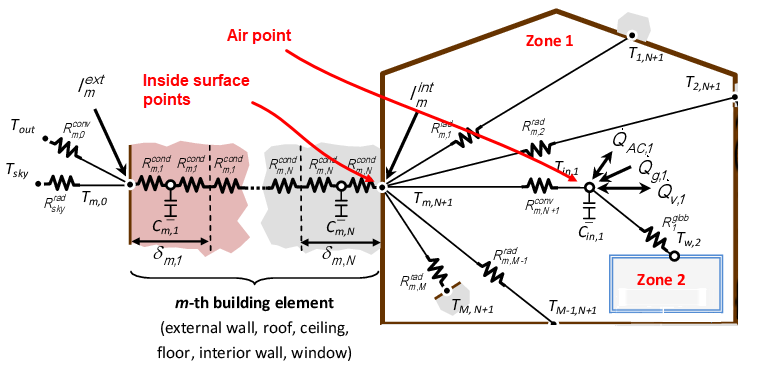
To understand more clearly we need to consider the nature of the building thermal resistance/capacitance network used in E+ (actually E+ uses a response factor method by default but the same principle applies). For each zone, you can think of the thermal network as a single zone air node and a series of nodes for each surface. All zone convective gains are accumulated at the air node and radiant gains at the internal surface of each wall, window, roof etc. Conceptually speaking there is a resistance between the zone air and surface nodes and heat flows between them (through Rconv in the diagram below). The key to understanding the apparent discrepancy is that heat transferred to/from the surface nodes is not equivalent to heat exchanged at the air node. So the surface heat gains can’t simply be combined together with gains at the air point to calculate cooling system sensible gain.
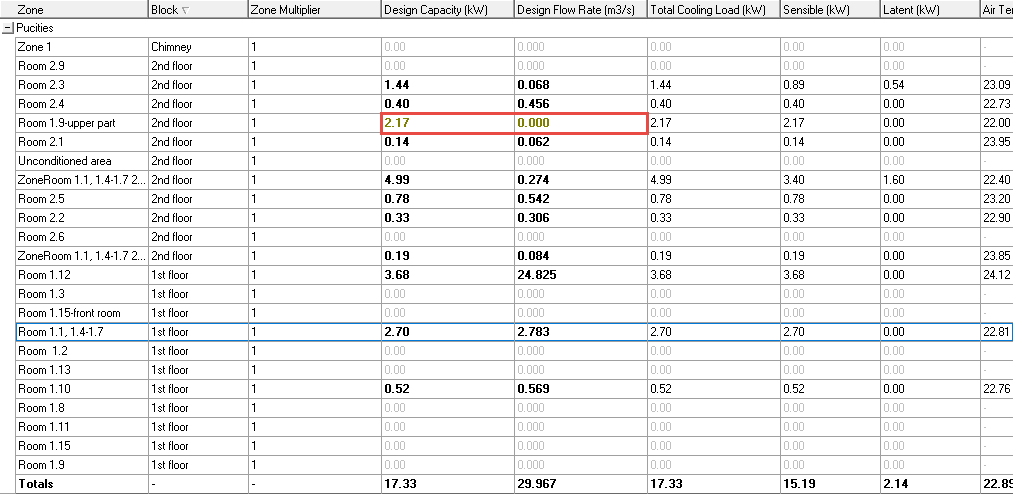
In some cases, DesignBuilder may not be able to calculate a supply air flow rate, and in these cases, results may be displayed in brown bold text. This can occur when the cooling supply air temperature is the same as, or very close to, the zone air Cooling setpoint temperature which would lead to a divide by zero error. In such cases, the Design flow rate is set to zero and summary results are displayed in brown, even if there is actually a very small cooling load.
The screenshot below illustrates.