Location tab on model data at Site level
This data are defines the elevation of the site relative to sea level (in m or ft) and is passed directly to EnergyPlus for use in pressure-related calculations. It is also used to calculate air density within DesignBuilder when calculating volumetric flow rates from cooling loads.
The site orientation is the angle of the site plan view relative to North. For example enter 45 to rotate the building(s) clockwise by 45°.relative to North (screenshot example below). This is the quickest and most reliable way to rotate all the buildings on the site relative to North and allows you to keep your x and y axes aligned with the building.
North is indicated by the direction of the North arrow in the sketch plan view (above).
Warning: Rotating the building(s) is also possible but once this has been done it is more difficult to make further geometric edits because, for rotations other than 90, 180 or 270°, the x and y axes will be out of alignment with the building. Also major rotations can increase the risk of geometric issues in the model.Exposure to wind
The exposure to wind model data affects the pressure coefficients used when the Calculated Natural ventilation option is set. It also affects the calculation of U-values (though these are not used in EnergyPlus simulations).
Important note: When the wind exposure setting is changed, the U-value for each construction in the Constructions database is recalculated because the wind exposure affects the external heat transfer coefficient. This is necessary to ensure that the info panel data remains up to date and for local calculations such as SBEM which rely on U-values being up to date.
The texture used to represent the ground in the rendered view on the Visualisation screen.
This is a decimal number between 0.0 and 1.0 and is used to characterize the average reflectivity of the ground throughout the year. Ground reflectance data is used to calculate the ground reflected solar radiation. This fractional amount is used in the following equation:
GroundReflectedSolar = (BeamSolar x COS(SunZenithAngle) + DiffuseSolar) x GroundReflectance
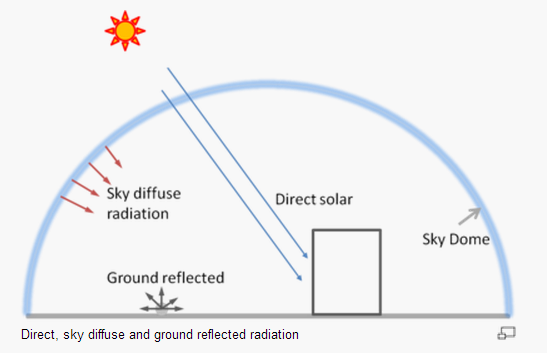
Reproduced from the IBPSA BEM Book.
Important Note: Reflection from the ground is calculated even if the Reflections option is not used, but if reflections are not calculated the ground plane is considered unobstructed, i.e., the shadowing of the ground by the building itself or by component blocks is ignored. Shadowing of the ground-reflected radiation by component blocks is only taken into account if the Reflections option is used. Conclusion: Switch Reflections on for accurate shading calculations.
The ground surface reflectance is also used to quantify the reflection of visible light in the Daylighting calculations.
Some typical ground reflectance values are shown for various surface types below.
| Surface Type | Surface Reflectance |
| Water (large angle of incidences) | 0.07 |
| Coniferous forest (winter) | 0.07 |
| Bituminous and gravel roof | 0.13 |
| Dry bare ground | 0.20 |
| Weathered concrete | 0.22 |
| Green grass | 0.26 |
| Dry grassland | 0.2 to 0.3 |
| Desert sand | 0.4 |
| Light building surfaces | 0.6 |
Ground Reflectance of Foreground Surfaces from ASHRAE 2009 HOF, Source: Adapted from Thevenard and Haddad (2006).
The default ground reflectance is 0.2.
A number between 0.0 and 10.0 which is used to modify the basic ground surface reflectance when snow is on the ground. Note that the value of GroundReflectanceUsed (below) must be <=1.
GroundReflectanceUsed = GroundReflectance x ModifierSnow
During simulations, the ground is considered to be snow-covered when the SnowDepth data in the hourly weather file is > 0.
From the IBPSA BEM Book:
| Site exposure | Reflectance of snow-covered ground |
| Typical city centre | 0.2 |
| Typical urban site | 0.4 |
| Typical rural site | 0.5 |
| Isolated rural site | 0.7 |
The default modifier is 2 for both solar and daylight radiation, giving an overall default reflectance for snow covered ground of 0.2 x 2 = 0.4, suitable for a typical urban site.
A number between 0.0 and 10.0 which is used to modify the basic ground surface reflectance when snow is on the ground. Note that the value of DaylightingGroundReflectanceUsed (below) must be <=1.
DaylightingGroundReflectanceUsed = GroundReflectance x ModifierSnow
During simulations, the ground is considered to be snow-covered when the SnowDepth data in the hourly weather file is > 0.
There are 12 fields allowing you to represent the mean ground temperature for each month of the year. These temperatures are used as the outside surface temperature for all surfaces adjacent to ground.
Note that the depth at which these temperatures apply depends on the thickness of the ground construction (see above) added to the main floor/wall construction.
Caution: It is generally not appropriate to use the "undisturbed" ground temperatures calculated by the weather converter and provided in the header of EnergyPlus hourly weather files as these values are too extreme for the soil under typical conditioned buildings. A reasonable default value of 2°C less than the average monthly indoor building temperature is appropriate for large buildings. For smaller buildings, the ground temperatures will be somewhere between that value and undisturbed ground temperatures.
More information about determining appropriate ground temperatures is given in Ground Modelling and in the EnergyPlus Auxiliary Programs document.
There are 12 fields allowing you to represent the deep ground temperature for each month of the year. These temperatures are only used when the 1-Deep Reference ground temperature option is used in a 15-Follow ground temperature Setpoint manager.
There are 12 fields allowing you to represent the shallow ground temperature for each month of the year. These temperatures are only used when the 1-Shallow Reference ground temperature option is used in a 15-Follow ground temperature Setpoint manager.
There are 2 ways to define the ground temperatures for F-factor and C-factor calculations which are defined through making one of the settings for the FCFactorMethod ground temperature source:
Check the Include ground domains checkbox to activate the ground domain model. This reveals an option to select the number of ground domain objects to use in the study. The number entered here will enable the display of that number of ground domain objects as shown below.
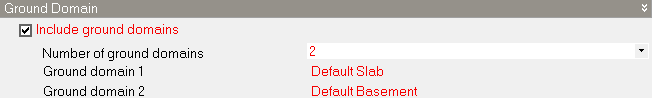
You will normally need to define new site domain objects to define the exact situation for your model.
Note: Ground domains are not used for heating and cooling design calculations. In this case surfaces adjacent to ground and assigned with ground domain objects use the Ground monthly temperatures as the other side.
Note: You must connect the ground domains defined and selected here to ground adjacent surfaces to complete the domain definition. Wall surfaces that are underground can be selected as basements and any floor that has any ground contact can be defined as having either slab or basement contact. Domain-surface connection settings can be made at any of building, block, zone and surface levels.
The Water Mains Temperature data is used to calculate water temperatures delivered by underground water main pipes. The mains temperatures are used as default, make-up water temperature inputs for the Water heater. The mains temperatures are also used in the water systems objects to model the temperature of cold water supplies.
Note: This data is only used when using Detailed HVAC. For Simple HVAC a single annual average mains water temperature is defined under the DHW header on the HVAC tab.
Water mains temperatures are a function of outdoor climate conditions and vary with time of year. A correlation has been formulated to predict water mains temperatures based on two weather inputs:
These values can be easily calculated from annual weather data using a spreadsheet or from the ".stat" file available with the EnergyPlus weather files at www.energyplus.gov. Monthly statistics for dry-bulb temperatures are shown with daily averages. The daily averages are averaged to obtain the annual average. The maximum and minimum daily average are subtracted to obtain the maximum difference. For more information on the water mains temperatures correlation, see the EnergyPlus Engineering Document.
Alternatively, the water mains temperatures can come from a schedule. This is useful for measured data or when water comes from a source other than buried pipes, e.g., a river or lake.
Select from the options:
If the Calculation method is 1-Schedule, the water mains temperatures are read from the schedule referenced by this field. Note that the schedule temperatures must be in °C even when using IP units.
If the Calculation method is 2-Correlation, this field is used in the calculation as the annual average outdoor dry-bulb air temperature (in °C or °F).
If the calculation method is 2-Correlation, this field is used in the calculation as the maximum difference in monthly average outdoor air temperatures (in Δ°K or Δ°F).
The Site precipitation data is used to describe the amount of precipitation on all Green roof surfaces over the course of the simulation. Precipitation includes both rain and the equivalent water content of snow. Precipitation is not yet described well enough in the usual building weather data file. So this object is used to provide the data using Schedule objects that define rates of precipitation in meters per hour. A set of schedules for site precipitation have been developed for USA weather locations and are provided with EnergyPlus in the data set called “PrecipitationSchedulesUSA.idf.” The user can develop schedules however they want. The schedules in the data set were developed using EnergyPlus’ weather file (EPW) observations and the average monthly precipitation for the closest weather site provided by NOAA. EPW files for the USA that were based on TMY or TMY2 include weather observations for Light/Moderate/Heavy rainfall, however most international locations do not include these observations. The values were modeled by taking the middle of the ranges quoted in the EPW data dictionary. The assumed piecewise function is shown below.
| Amount | Light | Medium | Heavy |
| m/h | 0.0125 | 0.052 | 0.1 |
The values were inserted on hour by hour basis for the month based on the observations. Then each month was rescaled to meet the average precipitation for the month based on the 30-year average (1971-2000) provided by the NOAA/NCDC. Therefore, the flags in the EPW file match the precipitation schedules for the USA. Note that summing the average monthly precipitation values will not give you the average yearly precipitation. The resulting value may be lower or higher than the average yearly value. Once the typical rainfall pattern and rates are scheduled, the Site Precipitation data provides a method of shifting the total rainfall up or down for design purposes. Wetter or drier conditions can be modelled by changing the Design Annual Precipitation although the timing of precipitation throughout the year will not be changed.
Magnitude of total precipitation for an annual period to be used in the model. Value selected by the user to correspond with the amount of precipitation expected or being assumed for design purposes. The units are in meters. This field works with the following two fields to allow easily shifting the amounts without having to generate new schedules. Units are m/yr or ft/yr
The schedule that describes the rate of precipitation. The precipitation rate schedule is analogous to weather file data. However, weather files for building simulation do not currently contain adequate data for such calculations. Therefore, EnergyPlus schedules are used to enter the pattern of precipitation events. The values in this schedule are the average rate of precipitation in meters per hour. The integration of these values over an annual schedule should equal the nominal annual precipitation.
Magnitude of annual precipitation associated with the rate schedule. This value is used to normalize the precipitation.
The Site Roof irrigation data is used to describe the amount of irrigation on all Green roof surfaces over the course of the simulation. You can define time-varying irrigation data using a maximum irrigation value and a schedule. There is also an option to apply some intelligence to the irrigation system to avoid over-watering the green roof.
Defines the way irrigation water is supplied. Select from:
Maximum rate of irrigation per hour. Units are m/h or ft/h.
The schedule defining the operation of the irrigation system. A schedule value of zero means the irrigation is switched off and a value of 1 means that the Max irrigation rate is used.
The Outdoor air CO2 and generic contaminants data at site level provides a way to select which contaminant types will be simulated. Although carbon dioxide is not normally considered to be an indoor contaminant it is used as an indicator of indoor air quality in buildings. From the simulation point of view EnergyPlus treats carbon dioxide as a type of contaminant. In addition to carbon dioxide, a generic contaminant type model is available.
These options should be selected if you wish to model CO2 or contaminant concentration levels in the simulation, either to monitor zone air quality or if DCV control is being used.
Note: DesignBuilder automatically selects the CO2 concentration and Generic contaminant concentration options below as appropriate if you have one of the IAQP DCV systems requiring CO2 or generic contaminant tracking selected in a Detailed HVAC model.
Check this option if simulation of CO2 concentration levels are to be performed.
Select the schedule that defines outdoor air carbon dioxide level values in units of ppm.
Check this option if simulation of generic contaminant concentration levels are to be performed.
Select the schedule that defines outdoor air generic contaminant level values in units of ppm.