Case Studies > Climate Analytics
Creating a National Weather Dataset Using DesignBuilder Climate Analytics
| About | Standardised location-specific national weather data sets for design stage modelling. Comparing the variations across regions and topography. | 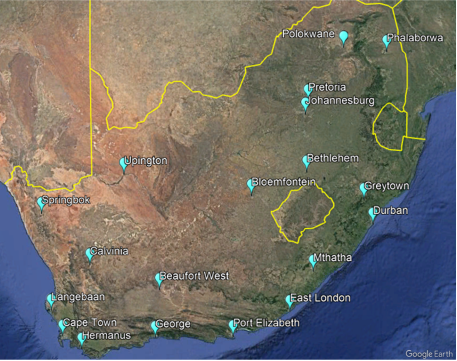 |
| By | Kenny Allen, Greenplan Consultants, South Africa. | |
| Location | 19 locations across South Africa. | |
| Data Used | Typical Meteorological Year (TMY). | |
| Category | Design Stage Modelling. | |
| Highlights |
|
Background
South Africa introduced a requirement for building energy efficiency in 2011, and since then most types of buildings (residential, schools, hotels, offices, etc.) have had to meet obligatory energy performance targets during the plan submission and municipal approval process. The building regulations (and associated standard, SANS 10400 XA) currently allow for three routes to show compliance:
- Deemed-to-satisfy (tick-the-box compliance)
- Performance modelling (also known as the “tables” route)
- Reference building comparison modelling
Route 1 is the simplest route and no energy modelling of the building is done; instead, the responsible person simply ensures that all the minimum requirements are met for the individual elements of the building envelope and systems: wall, window, floor and roof constructions, and hot water, air-conditioning, and lighting.
Routes 2 and 3 both require modelling of the building over a full year with annual hourly weather data. The intention is to determine the theoretical heating and cooling energy required to keep the building temperature between 19-25 °C for 95 % of the year. The modelling must take into account the entire building envelope, external shading, and all lighting, ventilation and HVAC equipment, as well as equipment heat loads in some building occupancies. As long as the building uses less energy for HVAC, lighting and hot water than a reference building specified by the standard, it passes. DesignBuilder is Agrément South Africa approved for XA assessment work and has been used extensively for Routes 2 and 3 over the past years.
For the first edition of SANS 10400 XA, modellers were required to use six sets of official weather data for the six different climate zones the country was divided into. However, with the release of SANS 10400 XA Ed. 2: 2021, the compulsory weather data restriction was removed, leaving modellers free to make rational decisions as to which weather data to use. While this arguably allows for better modelling, it does raise the question of standardisation and what weather data can be used for a given location. For example, under SANS 10400 XA Ed. 1: 2011, the same weather file was used for Alexander Bay and Port Elizabeth, locations on opposite sides of the country, about 900 km apart as the crow flies and in totally different climates. Now that the restriction has been removed, the question could be asked: should that practice be continued?
New weather data package
To help energy modellers in South Africa select weather data, GreenPlan, the DesignBuilder reseller in South Africa, has developed a set of standard location and weather data templates to meet the requirements of the latest XA standard. In keeping with DesignBuilder’s principle of making the modelling process as straightforward as possible, the new weather data is provided as a package to simplify installation. The package includes a set of Location templates with heating and cooling design data, hourly weather data components as well as the main epw hourly weather files and the associated ddy, stat and audit files for each location.
To install the package, users simply have to import a ddf file which includes the required templates and copy the weather data files into the DesignBuilder weather file repository. When modelling, users select the required location template which loads the appropriate weather data. The advantage of this approach is that it helps to standardise the weather data used in the DesignBuilder community, while at the same time reducing the scope for user error.
The new DesignBuilder Climate Analytics service was used to generate the hourly weather data covering key locations in the country where DesignBuilder already has ASHRAE design data.
The rest of this case study explains the process that was used to create a set of representative hourly weather data.
Locations
South Africa is a large country by European standards, with a huge variation in topography and climate. It ranges from dry semi-desert all the way to wet, humid sub-tropical areas on the east, and mountain peaks that reach an altitude as high as 3.7 km on the eastern escarpment. At the south-western tip, Table Mountain, a relatively small mountain compared to others in the country, is renowned for causing local micro-climates within the city of Cape Town. Johannesburg, possibly the most important city, is at an altitude of about 1.7 km while Pretoria, only 50 km away from Johannesburg, is 300-400 m lower and consequently has temperatures that are typically 3 °C warmer. By contrast, De Aar, Kimberley and Bloemfontein are relatively far apart but have a similar or smaller difference in typical summer temperature to that between Johannesburg and Pretoria.
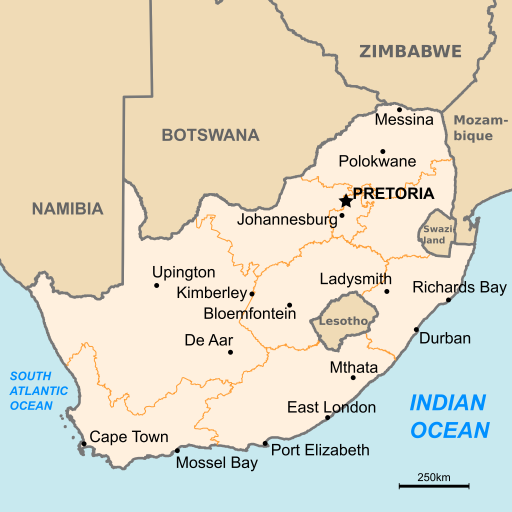 Figure 1: Map of South Africa showing some key cities [1] |
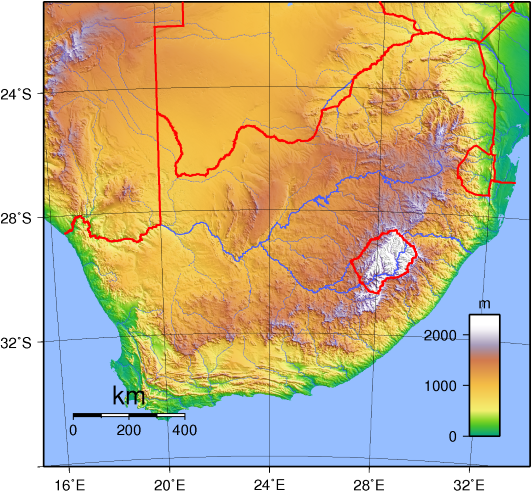 Figure 2: South African topography [2](white: high altitude; green: low altitude) |
The average population density is about 50 people per square kilometer, but most of the population (about 60 million) lives in cities. The exact population per city is difficult to specify as some sources include outlying areas and others don’t, but to give some idea, Cape Town, Pretoria, Johannesburg, Durban, Bloemfontein, and Port Elizabeth (Gqeberha) combined can easily lay claim to a third of the country’s population. The population density is highest in the east and the south; the centre and north-west has a very low population density because it is arid (see Figure 3).
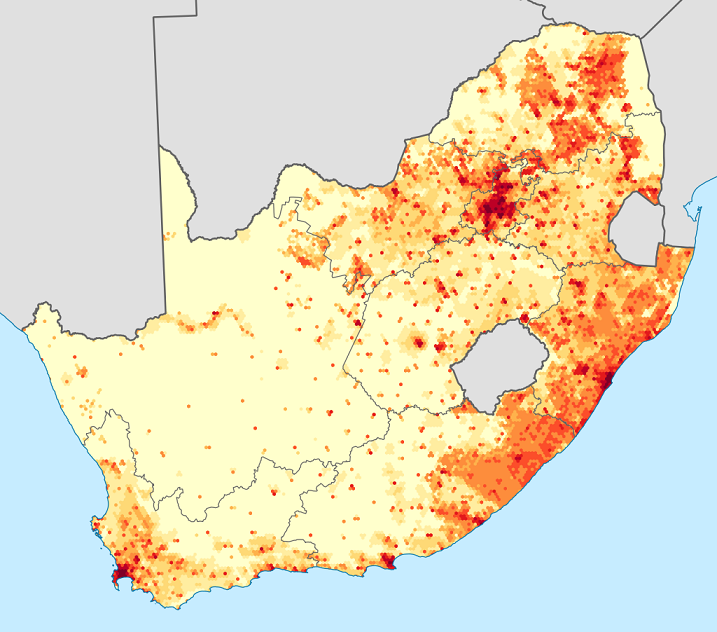
Figure 3: South African population density [3] (Red: high; white: low density)
The above factors make the choice of weather data locations somewhat challenging. At a practical level the areas with the largest populations are of primary importance since most building is done here. The central and north-western arid areas have a low population density and the weather is much less variable with distance since the topography is flatter. However, there will still be building in the low population areas, so some reasonably representative data is needed.
The following 19 centres were chosen, based on population size, distance from the next nearest weather dataset, and rapidity of variation in climate with distance (e.g. due to proximity to the ocean or mountains):
Table 1: Selected locations
| City | Province |
|---|---|
| Beaufort West | Western Cape |
| Bethlehem | Free State |
| Bloemfontein | Free State |
| Calvinia | Northern Cape |
| Cape Town | Western Cape |
| Durban | Natal |
| East London | Eastern Cape |
| George | Western Cape |
| Greytown | Natal – N of Pietermaritzburg |
| Hermanus | Western Cape |
| Johannesburg | Gauteng |
| Langebaan | Western Cape |
| Mthatha (Umtata) | Eastern Cape |
| Phalaborwa/Hoedspruit | Limpopo |
| Polokwane (Pietersburg) | Limpopo |
| Port Elizabeth (Gqeberha) | Eastern Cape |
| Pretoria | Gauteng |
| Springbok | Northern Cape |
| Upington | Northern Cape |
The existing data for Joburg and Cape Town included with DesignBuilder can be used, so no new data was generated for them.
Method used to create the TMY weather files
To ensure the highest possible quality of weather data, the Climate Analytics “Actual” data option was used. This is based on the most accurate available measured hourly data from NASA and various other sources. The Climate Analytics “Design” TMY ANSI/ASHRAE (1995-2015) selection algorithm was used to calculate the typical months, from “A” quality data sites only. Data for these months was then spliced together to create a typical TMY file for each of the new weather data sets created (refer back to Table 1).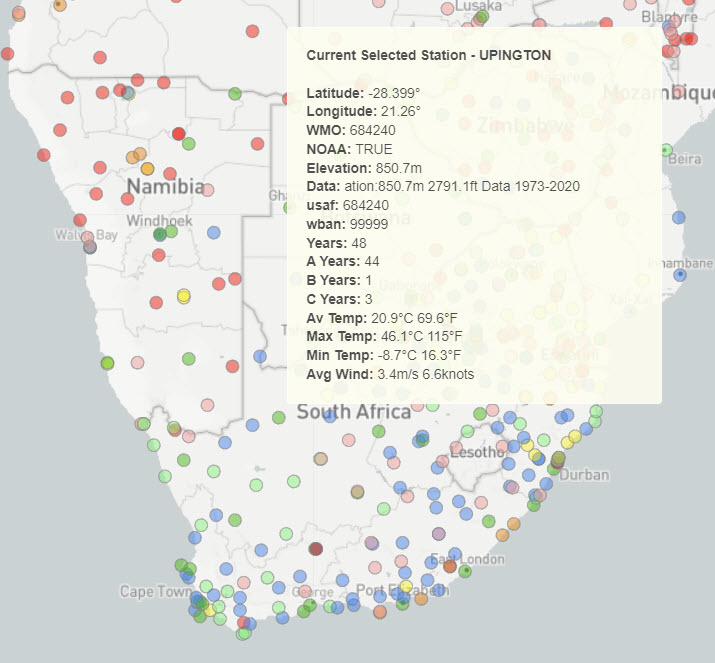
Comparison of weather data for various areas
The areas of most interest and the trends are highlighted in this section. Due to the number of locations, not all are explicitly discussed.
The east of the country has a combination of sea, coastal plateau, and high mountains (the Drakensberg, where the highest peaks reach over 3.5 km). This leads to rapid change in climate from place to place in these regions. For example, Durban is a coastal city (Indian ocean) and tends to be warm and humid. Greytown is only 100 km away but is at an altitude of about 1 km, leading to significantly lower temperature and humidity.
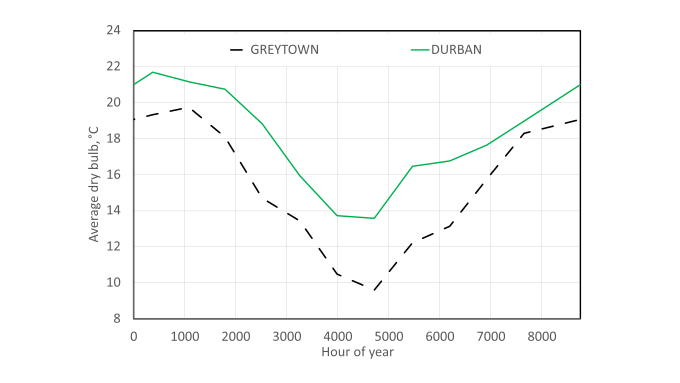 Figure 4: Durban and Greytown – average monthly dry bulb temperature |
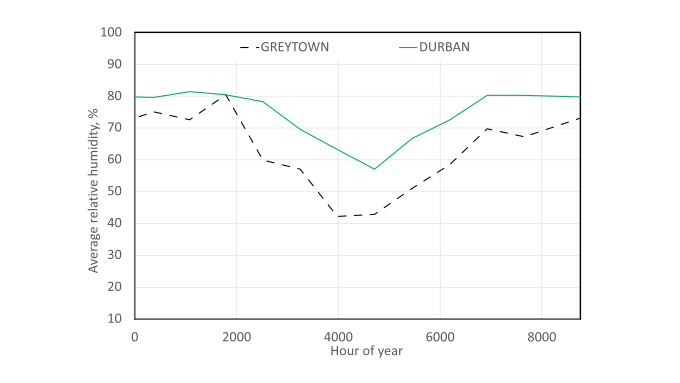 Figure 5: Durban and Greytown – average monthly relative humidity |
The intention is that users select Greytown for locations on the plateau, even if they are closer to Durban in terms of distance, and that Durban be used for the low-lying coastal region specifically.
Histograms showing the temperature distribution frequency are provided below. They were generated using DView [4], a freely available tool for processing and viewing epw files. The most common temperature brackets in Durban are between 16-20 °C, while those in Greytown are between 13-18 °C.
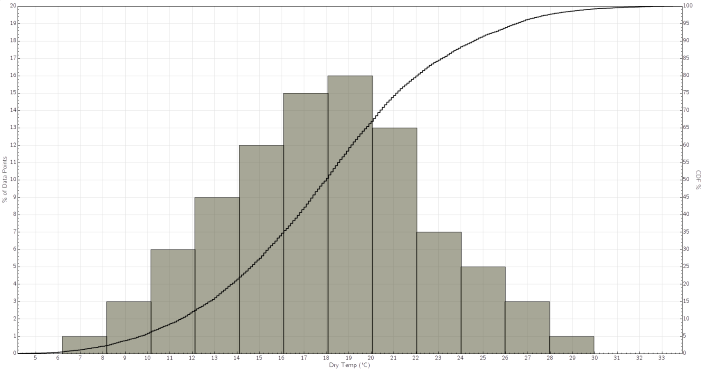
Figure 6: Durban – annual temperature distribution frequency
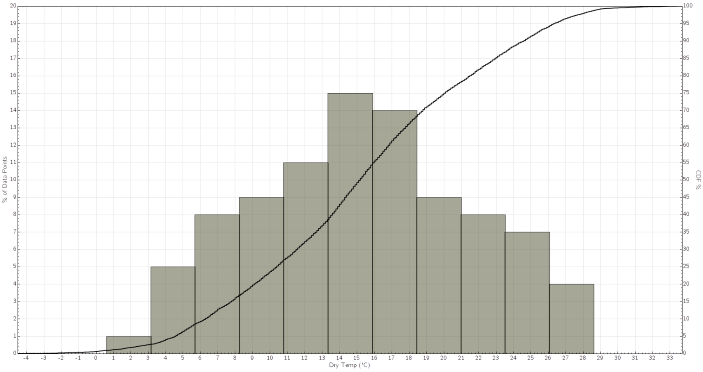
Figure 7: Greytown – annual temperature distribution frequency
There are mountains in the vicinity of Cape Town and there are mountain chains on or relatively near the coastal plain that stretches most of the way from Cape Town to Port Elizabeth. This causes noticeable variation in weather from place to place. Hermanus, a rapidly growing town popular with remote workers, is on the coast about 90 km east of Cape Town, and has a warmer winter and cooler summer than Cape Town. Langebaan, 100 km up the west coast from Cape Town, is warmer than Cape Town most of the year. This makes a difference as to which predominant conditions a building must be designed for, and using weather for each location instead of just using generic Cape Town weather for the whole region (as was the case previously) will lead to a better representation of the actual building performance. Consequently, the building design will be better aligned with the actual conditions.
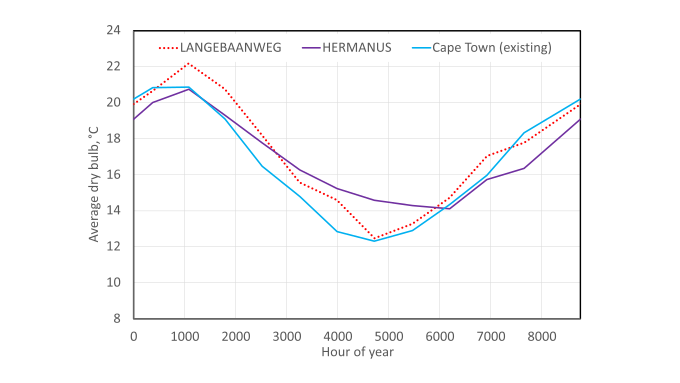
Figure 8: Cape Town, Hermanus and Langebaan – average monthly dry bulb distribution
The histograms below show the general trends; the most common temperature bracket for Hermanus is 15-16 °C, that for Langebaan is 14-16 °C, and that for Cape Town is 16-18 °C. However, Cape Town has the broadest spread, from 5-30 °C.
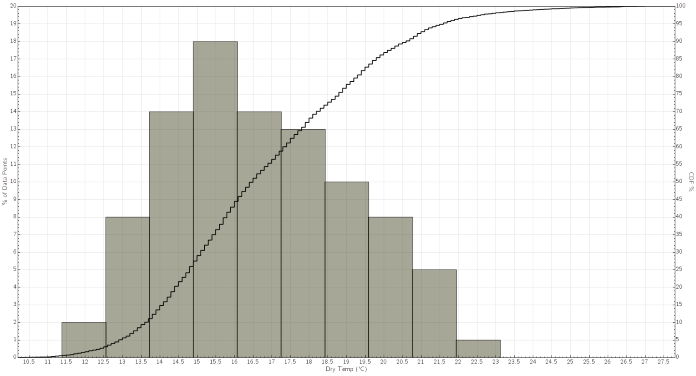
Figure 9: Hermanus– annual temperature distribution frequency
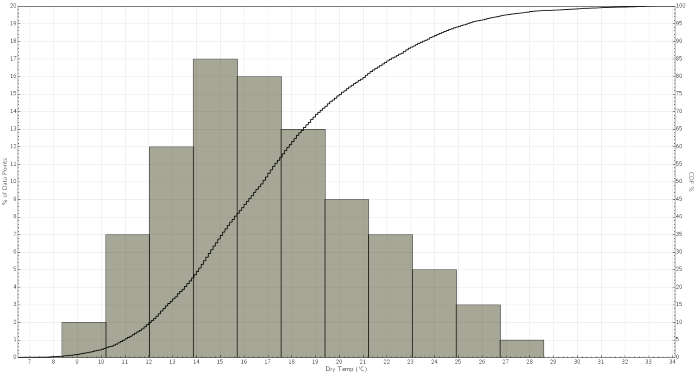
Figure 10: Langebaan– annual temperature distribution frequency
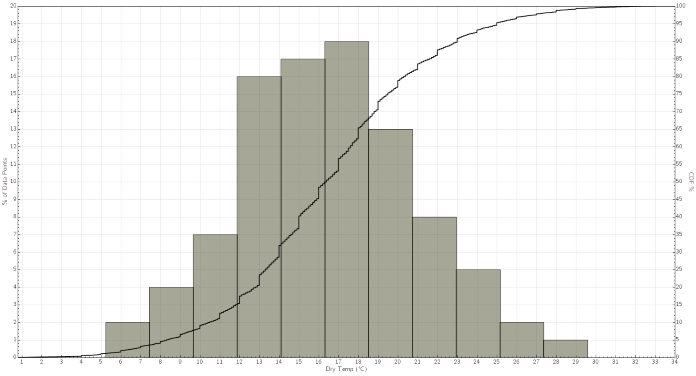
Figure 11: Cape Town– annual temperature distribution frequency
The intention is that users use the nearest coastal location for sites between the coast and mountains. For inland sites, the next closest location (most likely Beaufort West) should be used, at least until design data for Paarl/Stellenbosch/Worcester can be generated.
The arid central and western plateau has less in the way of mountains and so weather variation with distance tends to be much more gradual. However, because the distances are significant (for example, 500 km from Bloemfontein to Upington as the crow flies), there is still a noticeable change. Upington is situated at the southern end of the Kalahari desert region and is hotter and drier than Bloemfontein. Beaufort West is also situated in a low rainfall region about 500 km south-west of Bloemfontein but there is less variation than is the case for Upington. Bloemfontein is significantly colder in peak winter. Springbok is 800 km west of Bloemfontein in the far north-west of the country, about 80 km inland from the cold Atlantic and has smaller temperature extremes than the other locations shown. The differences between these locations can be seen in Figure 12.
In this region, the intention is that users simply select the closest location as there are no major modifiers like high mountains which have a significant impact.
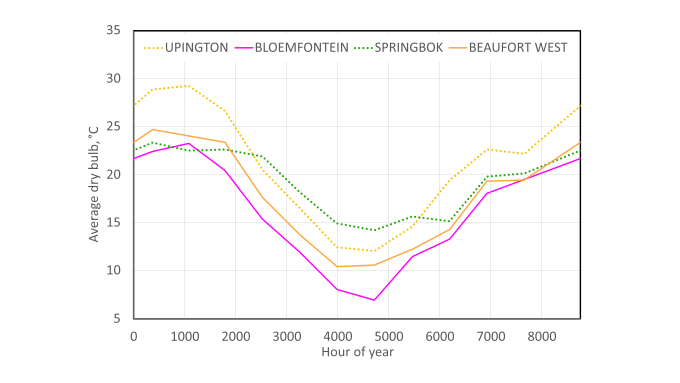
Figure 12: Bloemfontein, Beaufort West, Upington and Springbok – average monthly dry bulb distribution
Summary
The dry-bulb temperatures for all new locations are shown on one graph below to help the reader grasp how widely the climate varies across South Africa. Bethlehem and Bloemfontein tend to be coldest in winter. Upington is the hottest in summer, nearly 5 °C higher than the next highest temperature at peak summer, and undergoes a particularly drastic annual swing in excess of 15 °C, as does Bloemfontein. All new locations are shown on a map in Figure 13:
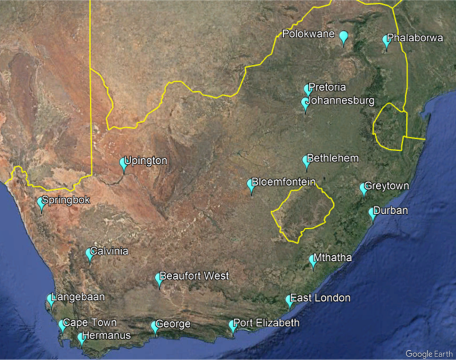 Figure 13: Weather data locations imposed on Google Earth [5] |
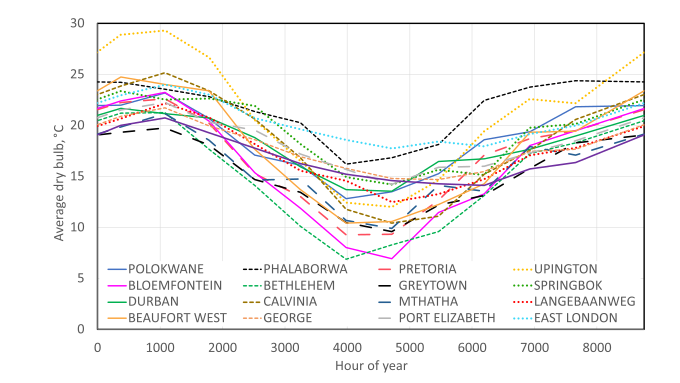 Figure 14: Average monthly temperatures for all chosen locations |
Custom locations and weather data modification In future it would be desirable to extend the data offered with more granularity in regions such as Swellendam, Franschhoek, Stellenbosch, Paarl and Wellington, as they have fairly distinct weather patterns that differ to Cape Town, Hermanus and Langebaan. In the meantime, more adventurous modellers can use the Climate Analytics tools to create hourly weather data themselves for any location as well as the associated design conditions for heating and cooling sizing calculations. The tools can also be used to create future weather years based on TMY, design summer years and a wide range of other base data and future weather scenarios.
References
- https://commons.wikimedia.org/wiki/File:Map_of_South_Africa.svg
- https://commons.wikimedia.org/wiki/File:South_Africa_Topography.png
- https://en.wikipedia.org/wiki/South_Africa#/media/File:South_Africa_2011_population_density_map_(hex_cells).svg
- https://github.com/NREL/wex/wiki/DView
- https://www.google.com/earth/versions/#earth-pro
 |
About the author |
