Parametric Studies - Choosing the Right Tool for the Job
By Andy Tindale, Chairman and Founder, DesignBuilder
One of the benefits of using building performance simulation in the design process is that it allows multiple variations on a base design to be assessed with little extra effort. This article explains how DesignBuilder's range of Parametric Analysis, Optimisation, Uncertainty and Sensitivity Analysis tools can be used at key stages of the design process as part of an evidence-based approach to design decision making. Each of these tools is intended to help answer certain types of question, and the article provides example applications for each to help you choose the right tool for the job.
Overview of Parametric Tools
Parametric Analysis is commonly used to generate design curves or histogram outputs to show how performance parameters like energy use, cost and comfort vary as key elements of the building design are adjusted. DesignBuilder can automatically run multiple simulations, adjusting up to 2 variables to create the design curve outputs. Design curves can be useful to help you understand how building performance is affected by variations in the building configuration and operation. For example, you can plot the variations in cooling demand for the base design with a range of window to wall ratios and glazing type variations. Or for future climate studies you can gain insights into building performance for a range of future climate scenarios (for more on this see the Examples Applications section below).
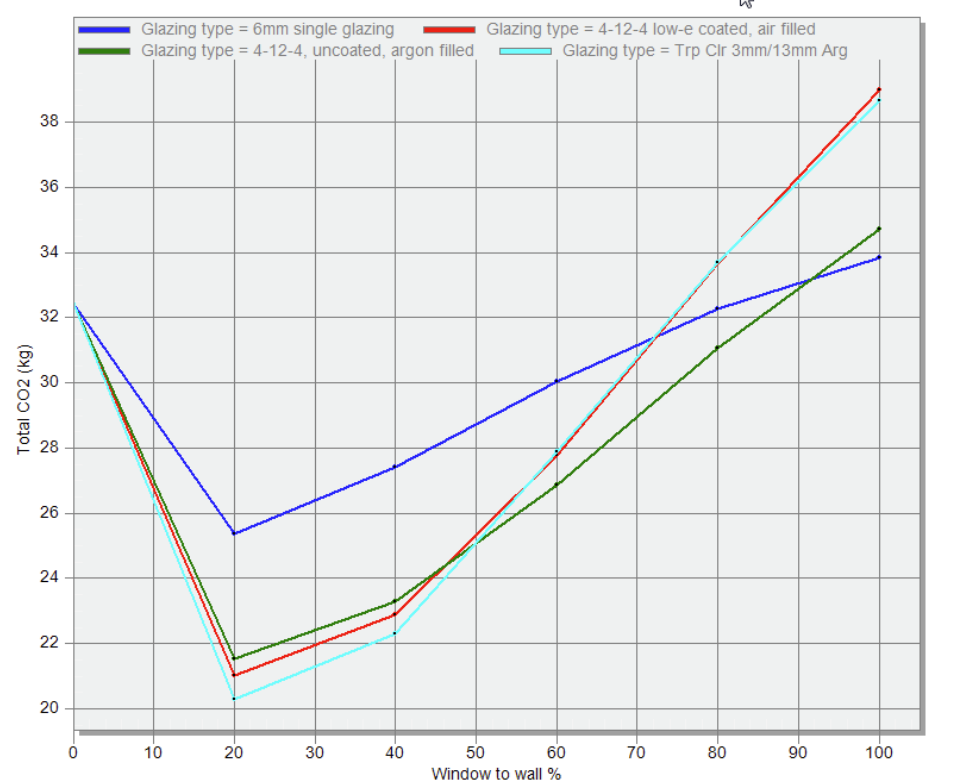
Figure 1 Typical parametric analysis design curve showing relationship between building CO2 emissions and WWR and glazing type.
Optimisation is a systematic technique for efficiently identifying the set of design options that best meet the design performance objectives that you define. Design constraints can be applied if, for example, you are only interested in design variants that are within your project budget, or you want to focus on solutions with discomfort hours below a set level. The parametric simulation results are often displayed as a point cloud to illustrate the trade-off between the 2 main design objectives, with the Pareto optimal solutions on the “leading edge” of the point cloud as shown in Figure 2 below.
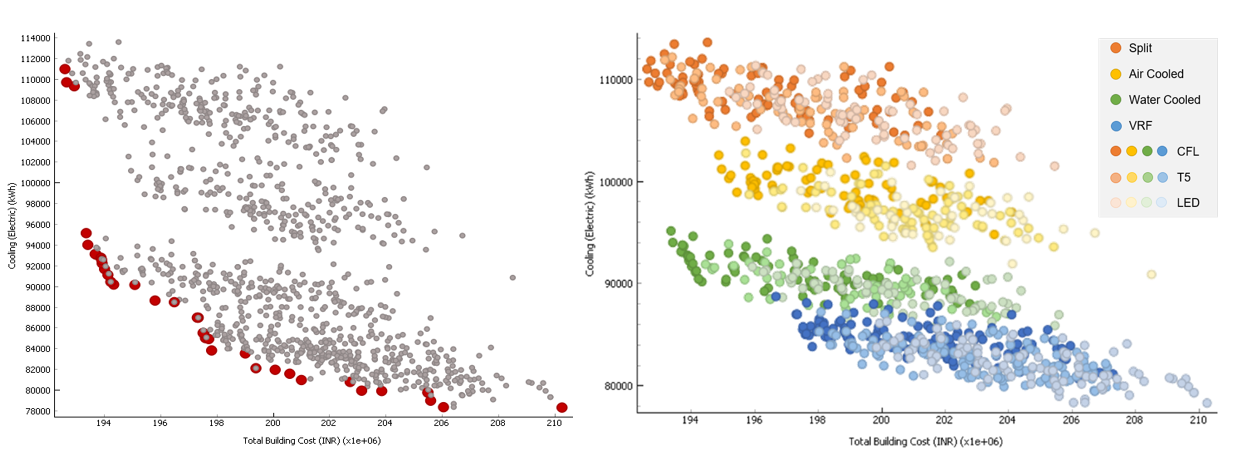
Figure 2 Optimisation results (left) and post-processed results (right)
The graph on the left above shows the parametric point cloud for all simulations in a design optimisation study with the optimum “Pareto Front” results highlighted in red, illustrating the trade-off between cooling energy and construction cost for a range of configuration options. The right-hand graph is the same data post-processed with colours to illustrate clusters of results with different characteristics to help gain a deeper insight into the performance variations.
Uncertainty Analysis. Building performance simulation is a complex process and many of the model inputs are often best available estimates and simplifications that do not necessarily represent the reality completely. These uncertainties can be due to lack of information, construction issues, occupant behaviour or even changes in weather. This can therefore limit our confidence in the outputs of the model. Uncertainty Analysis presents results as a "likely probabilistic range" rather than "deterministic fixed number”, helping to quantify the variability in the calculation results due to uncertainties in the model inputs.
Sensitivity Analysis. While uncertainty analysis quantifies the variability of a model's outputs due to uncertainty in the inputs, Sensitivity Analysis is the study of how the uncertainty in each simulation output can be apportioned to the various sources of uncertainty in its inputs. Sensitivity analysis is often used to report on the design variables having the greatest/least impact on the key simulation results. This can be a useful preliminary step to an optimisation analysis. Once the least important design variables have been identified they can be removed from the study to simplify the analysis and reduce simulation time. Sensitivity analysis can also be used to help manage risk in a systematic way, as part of energy performance contract analysis for example.
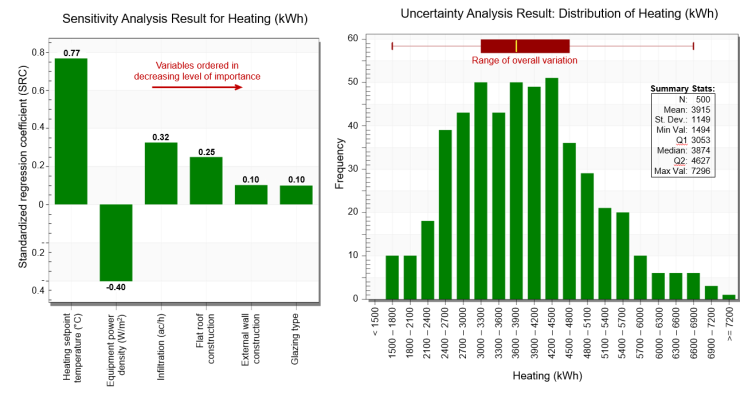
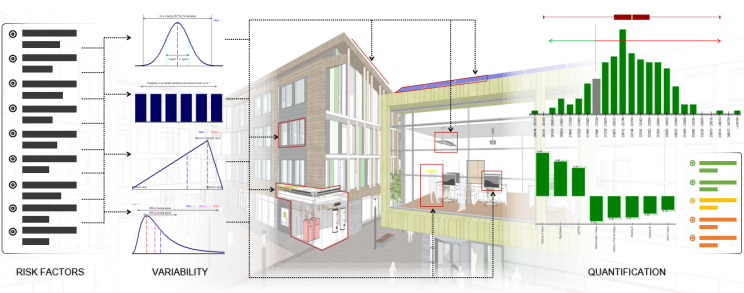
Figure 3 Example DesignBuilder Sensitivity and Uncertainty Analysis outputs.
Example Applications
This section includes some typical example applications along with some less obvious examples to provide ideas about how you might incorporate parametric tools as part of your energy modelling workflow.
Optimisation at early design stages
A common question at early design stages is "what are the most cost-effective facade configurations which minimise annual energy consumption while simultaneously ensuring occupant comfort". Because the façade affects so many aspects of the building operation (solar gain, daylight/glare, heat conduction, system sizes etc…) the answer is never simple! If there was a glazing type that reduces solar gain, has high daylight transmission, is low cost and has low embodied carbon then the question doesn't even arise! However this is rarely the case and some degree of trade-off will always be involved when specifying a façade design.
DesignBuilder's design optimisation tools allow you to identify a set of optimal design solutions and navigate the trade-offs, helping you decide how to prioritise the design objectives. Understanding the trade-off between the various design options and their impact on environmental performance allows designers to navigate the often complex relationship between design objectives, constraints and design options, allowing informed recommendations to be made with greater confidence.
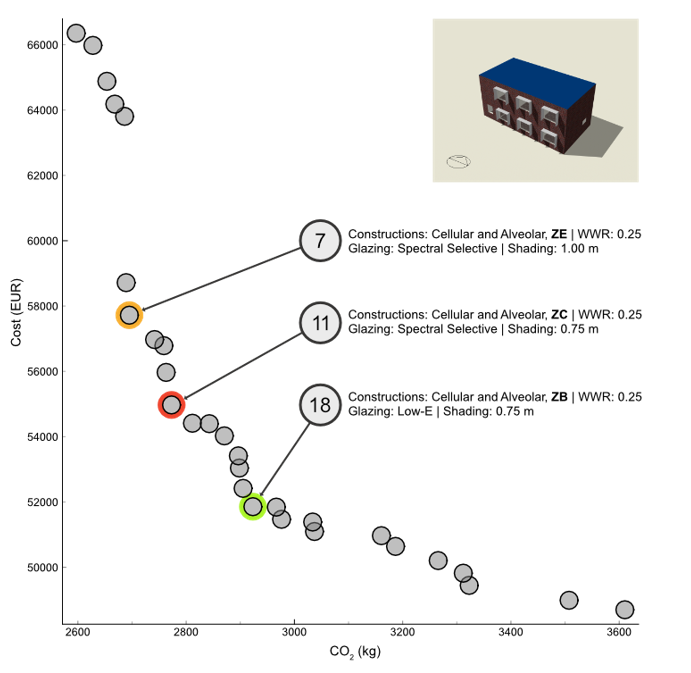
Figure 4 Example design study shows the trade-off between building CO2 emissions and construction cost for the optimum solution set only (full point cloud not displayed). The most “balanced”, cost-effective solutions are likely to be those closest to the origin, such as the solutions coloured in red and green.
Tuning HVAC system control parameters
Optimisation tools can also be used later in the design process to help identify the optimum set of control parameters for building HVAC and other systems. DesignBuilder's Program Help illustrates the possibilities through a simple worked example that explains the process of setting up and optimising a custom control rule to govern heating system optimum start times based on the night-time outside air temperature.
The optimum start algorithm uses DesignBuilder’s built-in EMS scripting tools to create a simple linear rule which calculates the heating system start time based on earliest and latest possible start times and their corresponding outside temperatures. The example study asks the question “what is the best ‘earliest start time’ to be applied in the algorithm that minimises both occupant discomfort and building heating load?" As you might expect, a trade-off is involved. The earlier the heating system can switch on, the less discomfort occupants are likely to feel on the coldest mornings of the year, but the more heating energy will be consumed over the year. The solution is to run an optimisation study with ‘earliest possible start time’ as a design variable and objectives to minimise both discomfort hours and heating energy. Because there is only one design variable, the point cloud forms along a curve and it’s simply a question of selecting a point on the curve that gives the best trade-off between early morning discomfort and heating energy.
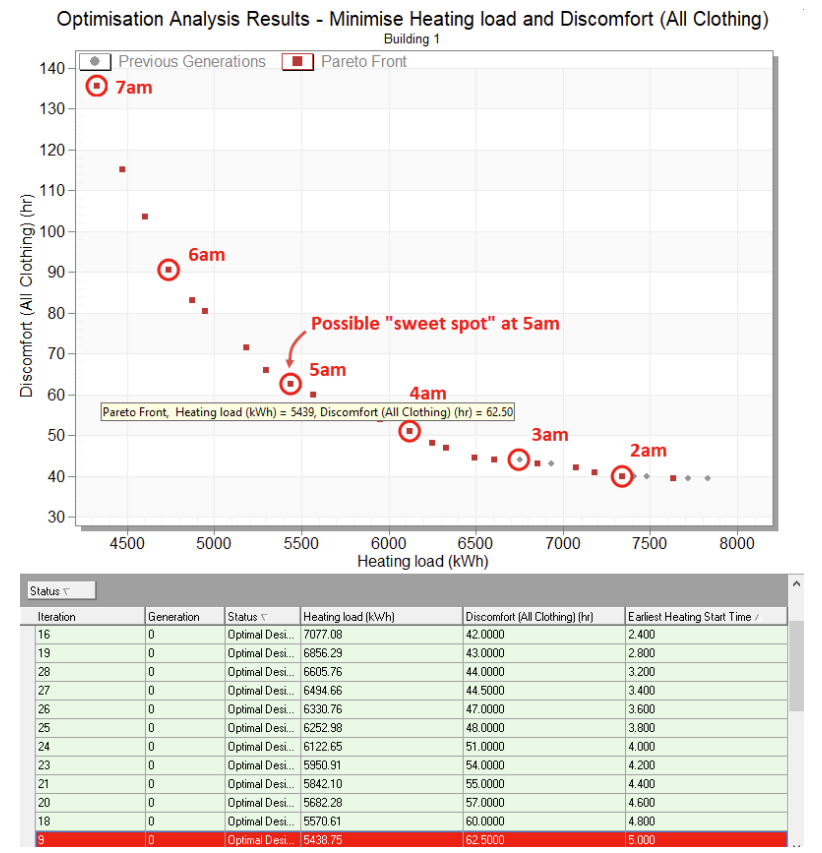
Figure 5 shows how variations in the "earliest start time" algorithm parameter affects heating load and discomfort.
Figure 5 shows that as the earliest allowed start time control parameter is reduced from 7am to 1am, the levels of discomfort decrease at the expense of higher heating energy. The results also show diminishing returns in terms of comfort when reducing the earliest start time much below 4am. A "balanced" option at around 5am was selected in this study.
A similar process can be used to help select one or more optimal settings in within any EMS script, or within the built-in EnergyPlus HVAC control systems.
Future climate studies
Building designers are increasingly being asked how their buildings will perform in future climate conditions. Of course it is far from clear how much warmer it will be, and how the solar incidence, wind and rainfall will be affected, especially as these factors will be influenced by policy decisions that are made now and in the future, as well as many other unknowns.
To help building designers assess future building performance, organisations such as CIBSE and CSIRO have issued sets of ‘future weather years’ for building simulation that take into account the impact of various projected climate change scenarios. These are based on a series of standard assumptions related to economic and population growth and to the effectiveness of the solutions applied. Future weather files can be used instead of the usual historical weather data in building models to assess future building performance.
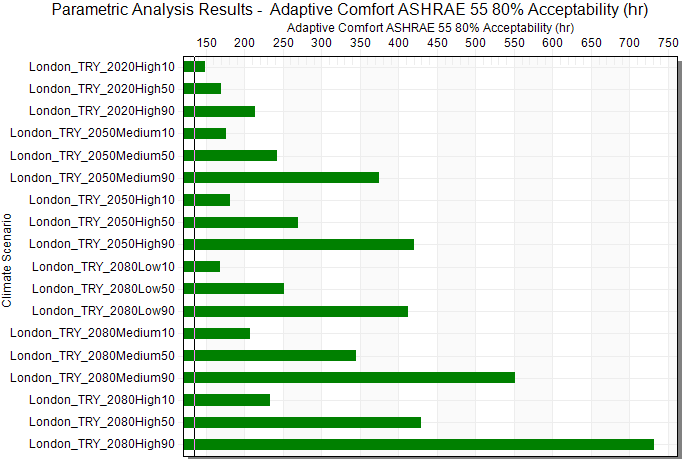
Figure 6 Impact of the range of CIBSE London future climate scenarios on predicted discomfort hours. The full range of CIBSE weather files can be ordered from the DesignBuilder website.
DesignBuilder offers a convenient way to assess the impact of future scenarios on building performance using its parametric analysis tools, which allow the weather data to be defined as a variable. KPIs such as discomfort hours, cooling energy or maximum load etc can be selected as the output or a new KPI can be created with a script.
The process involved in setting up and running a future climate study such as that illustrated in Figure 6 is explained in a tutorial in the DesignBuilder Program Help.
Energy performance contract analysis
Contractual performance targets are a powerful way of delivering building performance, however committing to such targets requires engineers to consider the risks and implications very carefully. A risk assessment can be carried out through a systematic uncertainty and sensitivity analysis to help to reduce the risk for all stakeholders.
Sensitivity testing was traditionally done by changing selected variables one at a time, which can be useful in evaluating the relative comparison of design decisions, but it cannot determine the effect of combinations of variables changing at the same time. DesignBuilder allows a much more rigorous parametric approach by changing multiple variables simultaneously to test a wider range of combinations and provide a more robust sensitivity analysis and uncertainty quantification.
Parametric sensitivity analysis and uncertainty quantification methods can help you manage the risk by indicating the probability of meeting the target performance. The analysis ranks the inputs according to importance, thereby indicating the parameters that require safeguards to ensure the performance targets are met. In this systematic approach, statistical metrics are used to determine the likelihood of achieving or missing the performance targets, and regression methods identify the design variables with the greatest influence on performance.
You can find out more about these techniques in our "Uncertainty and Sensitivity Analysis: Improve Decision-Making and Reduce Risk" webinar, listed below, which is based on a case study office building project in the UK subject to an energy performance contract. It shows how DesignBuilder’s UA/SA tools can help project teams create quantified risk assessment reports that allow them to measure and manage the risks associated with achieving performance targets for improved design and operational decision making.
Sensitivity analysis as a precursor to optimisation
Complex optimisation studies with a large number of design variables can be slow to converge and any unnecessary complexity makes it difficult to find clearly distinguishable trends. Some variables might not have a significant influence on the outputs which can make the assessment of the relative importance of other more important variables difficult. Sensitivity Analysis (SA) can be used as a precursor to optimisation to remove less influential variables from the optimisation runs, reducing the complexity and overall optimisation runtime. Also, if the variable is influential for only one of the objectives, its value can be predetermined with SA and removed from the optimisation. With a focus only on the important variables, the optimisation results are cleaner, quicker and more easily understandable.
Another advantage of using SA, is that it helps you to understand any trends associated with design variables and makes it easier to see these in the results. For example, SA can tell us the relationship of each design variable with the design objectives and whether they are directly or inversely correlated, providing insights into whether an increase in the design variable leads you towards or away from your design objectives.
You can read more about this technique on our Uncertainty And Sensitivity Analysis - Tips And Tricks help page. The technique is also demonstrated in the "Uncertainty and Sensitivity Analysis: Simplify and Speed up Optimisation Studies" webinar listed below.
Find Out More
There is plenty of content online to help you learn how to use DesignBuilder’s parametric tools, including free webinar recordings, program help, tutorials and our on-demand online training course.
Webinars
- Design Optimisation: Making Rigorous Cost-Benefit Simulations a Reality
- Uncertainty and Sensitivity Analysis: Simplify and Speed up Optimisation Studies
- Uncertainty and Sensitivity Analysis: Improve Decision-Making and Reduce Risk
- Optimizing an Eco-Friendly House Design using DesignBuilder
- Using DesignBuilder Optimisation to Design a Net Zero Building
Learning content
- Optimisation tutorials
- Parametric analysis tutorials
- Uncertainty and Sensitivity analysis tutorials
- The DesignBuilder Optimisation Fundamentals Package in our on-demand online training covers the theory and general concepts of optimisation, how to effectively and efficiently set up an optimisation study, and how to interpret optimisation results so as to gain insights into what is driving performance in your model. Click on the “DesignBuilder Optimisation Fundamentals” header towards the bottom of the page to find out more about this training package.
Case studies
DesignBuilder Optimisation tools have helped many projects identify the best possible solution and meet the design objective and requirements. Below are details of a couple of example projects that used DesignBuilder's Optimisation tool:
- Eco-Friendly House Design by Sol-Arq/EcoSostres - The project used design optimisation tools to produce savings of 31% on global costs (more than € 32,000), as well as a reduction of 41% on global emissions (above 60 tons) compared to any other average project. The project obtained the highest energy rating according to the Spanish Building Technical Code.
- Lowdown Showdown Modelling Challenge - The EUI of the baseline building was around 47 kBTU/ft2.year, whereas the EUI of our proposed building entry was 17 kBTU/ft2.year, a 64% reduction on the baseline.
Software modules
To run optimisation, uncertainty or sensitivity analyses in DesignBuilder you will need to have access to at least the Simulation and Optimisation modules. These are included in the Architectural Plus, Engineering Plus and Engineering Pro packages.
Hopefully this article has given you a good feel for the sort of parametric studies that are possible using the DesignBuilder toolset. For more information on the capabilities please contact our Support Desk.
 |
About the Author Andy Tindale is the Chair and co-founder of DesignBuilder Software. With decades of experience in the building energy simulation sector, Andy has amassed a wealth of knowledge through his work in academia, design consultancies, and R&D groups. He is deeply committed to removing unnecessary barriers to the widespread adoption of the latest building simulation technology. |