Case Studies > Climate Analytics
Cross-Sectoral Assessment of the Performance Gap Using Calibrated Digital Twin Models
| About | Use of actual weather files in developing calibrated ‘digital twin’ models per CIBSE TM63 protocol following ASHRAE Guideline 14 criteria | 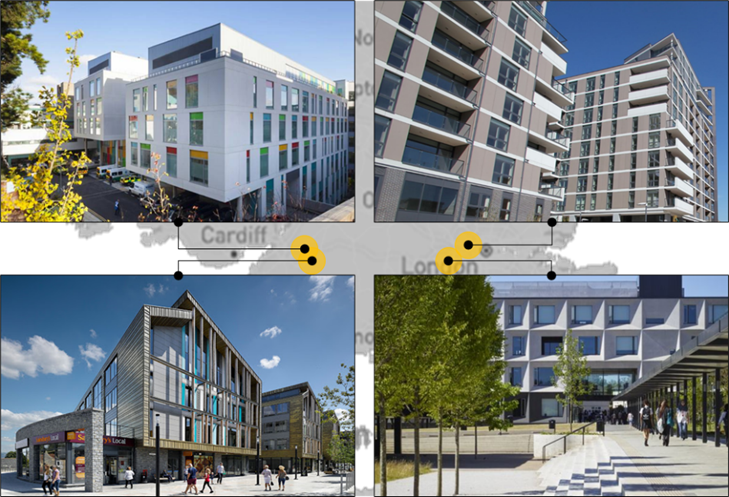 |
| By | Nishesh Jain, University College London, London, UK | |
| Location | Multiple locations across the UK | |
| Data used | Actual year weather data, custom location | |
| Category | Digital Twins, Existing Building, Retrofit | |
| Highlights |
|
Case Study Buildings and their Operational Performance Issues
The study covers four buildings, each in a different building category: an office, a school, a hospital, and an apartment block. The buildings are shown in the figure below. Analysing issues and improvements in these buildings relating to design, construction, operations, and management can provide significant cross-sectoral learning. Data for design and operation was collected for the buildings including recorded metered energy consumption and building use and management routines.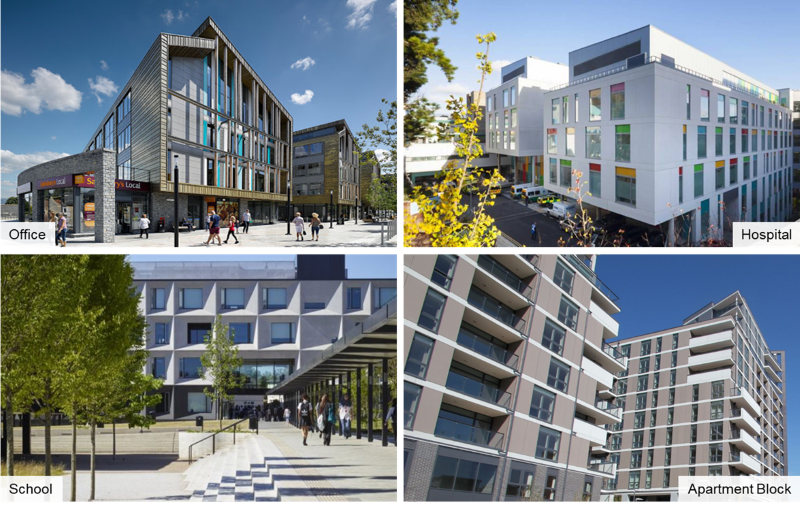
The actual performance of the buildings reported for one calendar year diverges from the intended design stage projections. The main deviations from the design stage intentions about the actual building’s management and operation are summarised in the table below. These deviations are considered to be the most likely cause of performance deviations for each of the buildings and formed the basis of evidence-based finetuning used during model calibration.
| Building | Issues |
| Office |
|
| School |
|
| Hospital |
|
| Apartment block |
|
Model calibration and use of actual weather data
CIBSE TM63 provides a step-by-step approach to assess the root causes of building operational performance. Its modelling-based operational performance assessment methodology relies on the development of a calibration model. The figure below shows the CIBSE TM63 calibration process required to develop the calibrated model to meet the ASHRAE Guideline 14 and IPMVP criteria.
The process starts with the as-designed (baseline) model of the case study building that was created using the design stage assumptions. The model at the design stage is simulated using typical year weather data from the nearest weather station.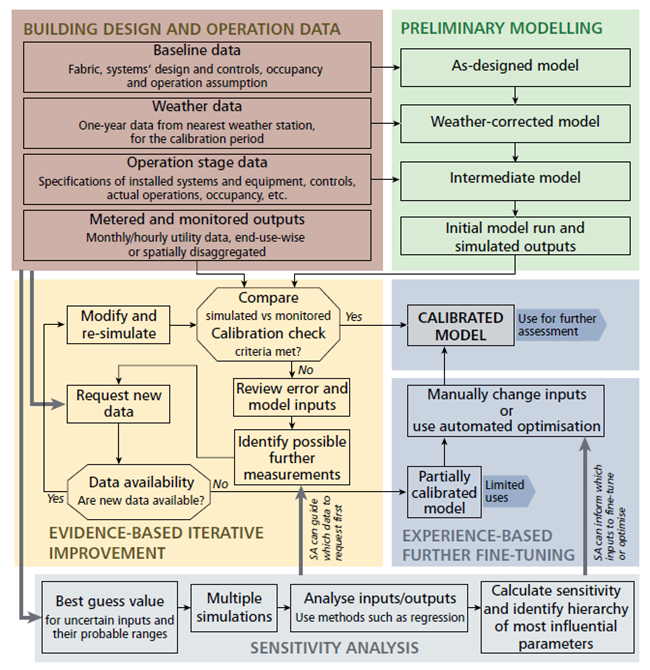
However, a key factor in the development of the calibrated model is the use of actual weather data corresponding to the site location. Actual year weather files were obtained from DesignBuilder Climate Analytics for the calibration period using the Create new location option. The actual year weather file used was for a custom location using the exact coordinates of the building site. For the case study buildings, details for the weather files used were as follows:
- Office: As-designed model – TMY file for Birmingham weather station (WMO: 035340); Calibration: Actual year data for November 2015 to October 2016 triangulated for the site location
- School: As-designed model – TMY file for London Gatwick weather station (WMO: 37760); Calibration: Actual year data for October 2016 to September 2017 triangulated for the site location
- Hospital: As-designed model – TMY file for Birmingham weather station (WMO: 035340); Calibration: Actual year data for November 2015 to October 2016 triangulated for the site location
- Apartment block: As-designed model – TMY file for London Gatwick weather station (WMO: 37760); Calibration: Actual year data for the year 2017 triangulated for the site location
It is important to note the typical year weather data used in design-stage assessments can differ significantly from the actual year data, as can be seen in the image below for the weather files used in the office case study’s as-design and calibration model. The TMY weather data used for Birmingham is colder than the actual site data during winters and has higher summer temperatures than those observed during the actual calibration period.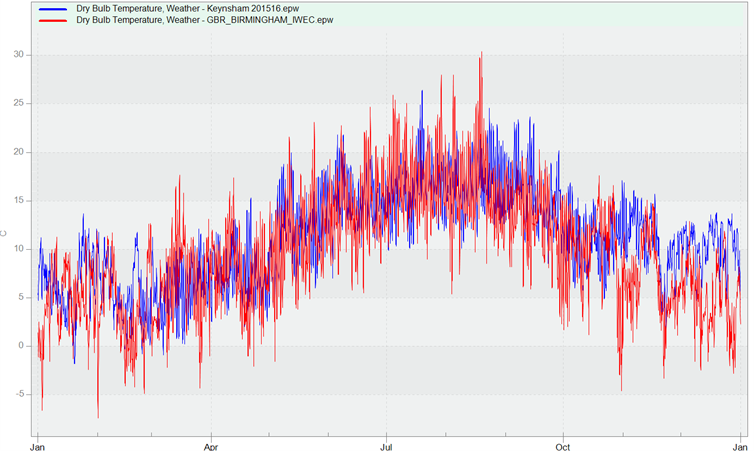
Calibration Results
The operational stage deviations in the building model definitions, identified earlier, were corrected and were also further fine-tuned during the calibration process. By using the correct weather data, operational assumptions, loads and system configuration, this building’s monthly energy use profile was estimated with an acceptable accuracy per ASHRAE Guideline 14, i.e. CVRMSE (Coefficient of Variation of Root Mean Square Error) was less than 15% and NMBE (Nominal Mean Bias Error) was within ±5%. The figure below shows the calibrated simulation results with their statistical error values for all the buildings.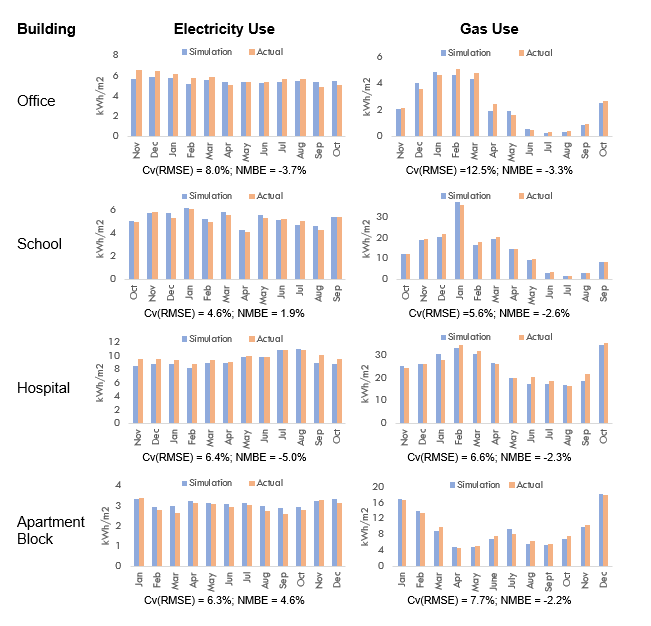
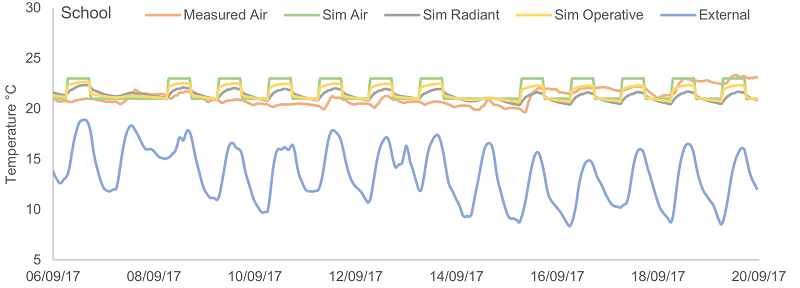
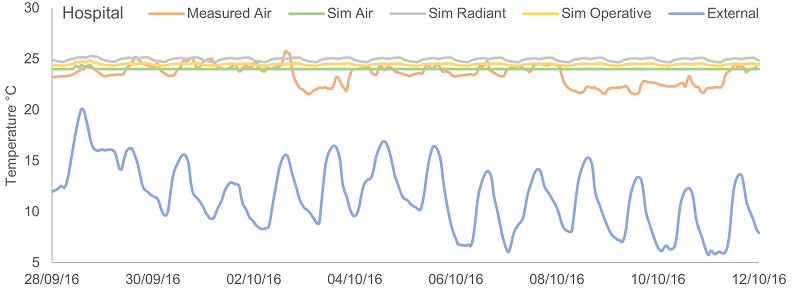
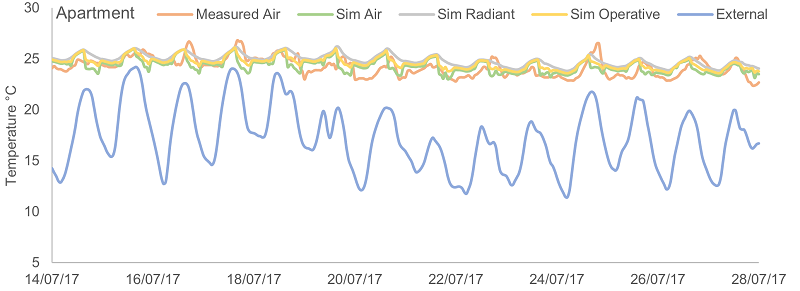
To ensure the calibrated model reasonably reflects the actual building’s operation, the figures below show the temperature trends for typical days for a few monitored spaces in all the buildings. The simulated temperatures closely follow the measured air temperature, except for the few instances where there are some notable deviations. When assessed over longer periods, these deviations were not considered to be of significant concern as the profiles of measured and simulated temperatures correlated well over the year. Further fine-tuning of the calibrated model at hourly resolution could have helped to address these deviations. However, in the context of monthly calibration for assessing the causes of the performance gap, the current accuracy is considered to be sufficient overall, with Mean Absolute Error (MAE) and Root Mean Square Error (RMSE) for the hourly temperatures being less than 1°C and 1.5°C respectively.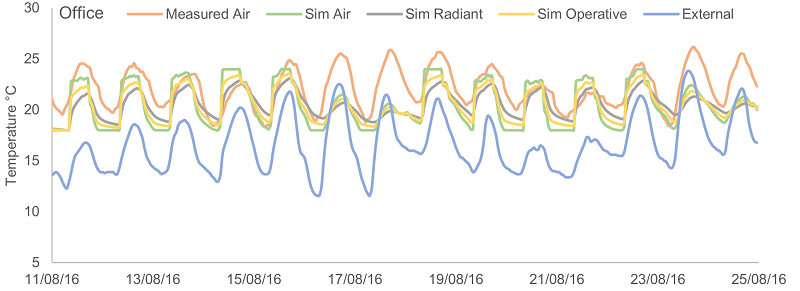
Summary and Further Information
This detailed analysis of the performance gap across multiple buildings provides insights into the performance issues applicable across the UK building sector. Identifying and verifying performance issues using evidence-based model calibration increases the likelihood of finding all the key issues. Calibrated models, when validated statistically, enable a systematic identification and classification of the root causes of the performance gap. Three main factors contributed to the root causes identified across the case studies: (i) use of inappropriate design-stage calculation methods, (ii) technical issues with the building, its systems, and their operations, and (iii) operational changes that the building has gone through to meet its functional requirements.
This work is part of larger research undertaken in relation to the operational performance of buildings. More information about the research and guidance on the topics covered can be found here:
- CIBSE TM63: Operational performance: Building performance modelling
- Journal Article: Cross-sectoral assessment of the performance gap using calibrated energy performance simulation
- PhD Thesis: Reducing the performance gap using calibrated simulation models
 |
About the author Contact: n.jain@ucl.ac.uk |